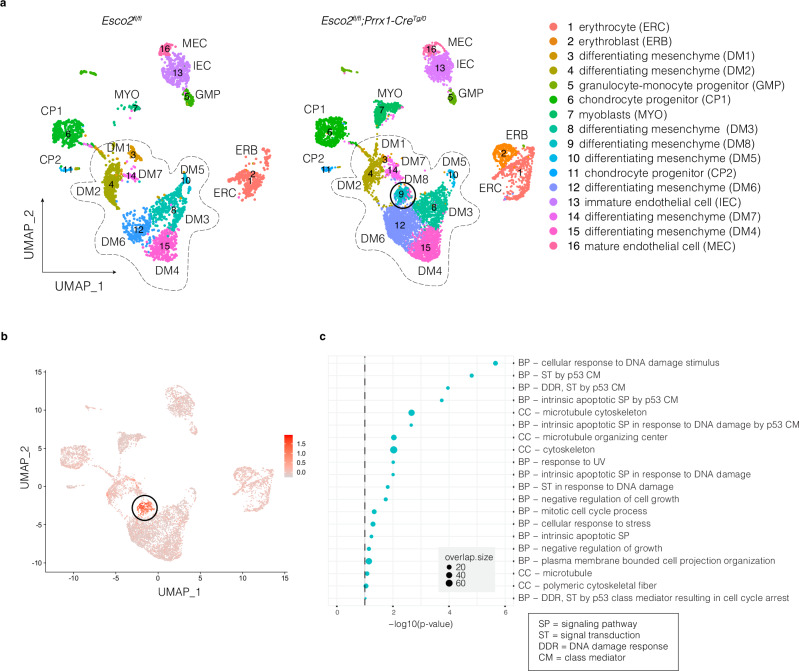
Fig. 3. Single-cell RNA-seq characterization of Esco2fl/fl and Esco2fl/fl;Prrx1-CreTg/0 clusters at E9.5.
a Uniform Manifold Approximation and Projection (UMAP) plot of cell clusters detected by unsupervised graph clustering of cell populations from Esco2fl/fl (left) and Esco2fl/fl;Prrx1-CreTg/0 (right) limb buds. b UMAP of the 25 marker genes expressed in DM8 that intersect with the DEGs identified in the bulk RNA-seq data at E9.5. c Gene ontology (GO) enrichment for upregulated and downregulated markers in DM8. Gene Ontology enrichment analysis was performed with a p-value ranked query and multiple testing correction by the g:SCS method (p ≤ 0.05). Dashed line indicates the threshold of significance (0.05).

