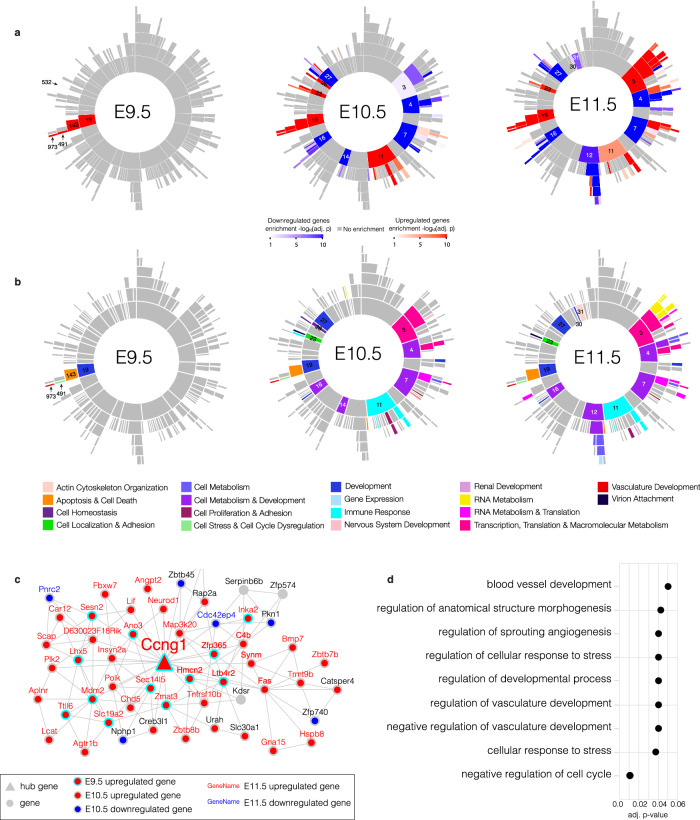
Fig. 4. Multi-scale embedded gene co-expression network analysis from E9.5-E11.5.
a Sunburst plots of the MEGENA based on bulk RNA-seq data from Esco2fl/fl and Esco2fl/fl;Prrx1-CreTg/0 limb buds from E9.5-E11.5. The inner most ring represents the root and largest parent modules, which branch off in hierarchical fashion to smaller child modules. Color intensity of red (upregulated) or blue (downregulated) is proportional to −log10(corrected FET p-value). Significant correlations between gene pairs were identified using the Pearson method with FDR < 0.05. b Sunburst plots with significant modules colored according to the most significantly enriched GO BP from E9.5-E11.5. c Module 973 (M973) from E9.5-E11.5. Hub genes and genes are marked by triangles and circles, respectively. Upregulated genes at E9.5 are marked by a red circle with a cyan border. Up- and down-regulated genes at E10.5 are marked by a red or blue circle with a gray border, respectively. Up- or down-regulated genes at E11.5 are marked by red or blue gene names, respectively. Gray circles are genes that are not enriched for DEGs. Hub gene name for Ccng1 is enlarged. d GO enrichment for BPs of M973 (adj. p-values ≤ 0.05). Gene set enrichment was performed against using Fisher’s exact test and Bonferroni correction to account for multiple hypothesis testing.

