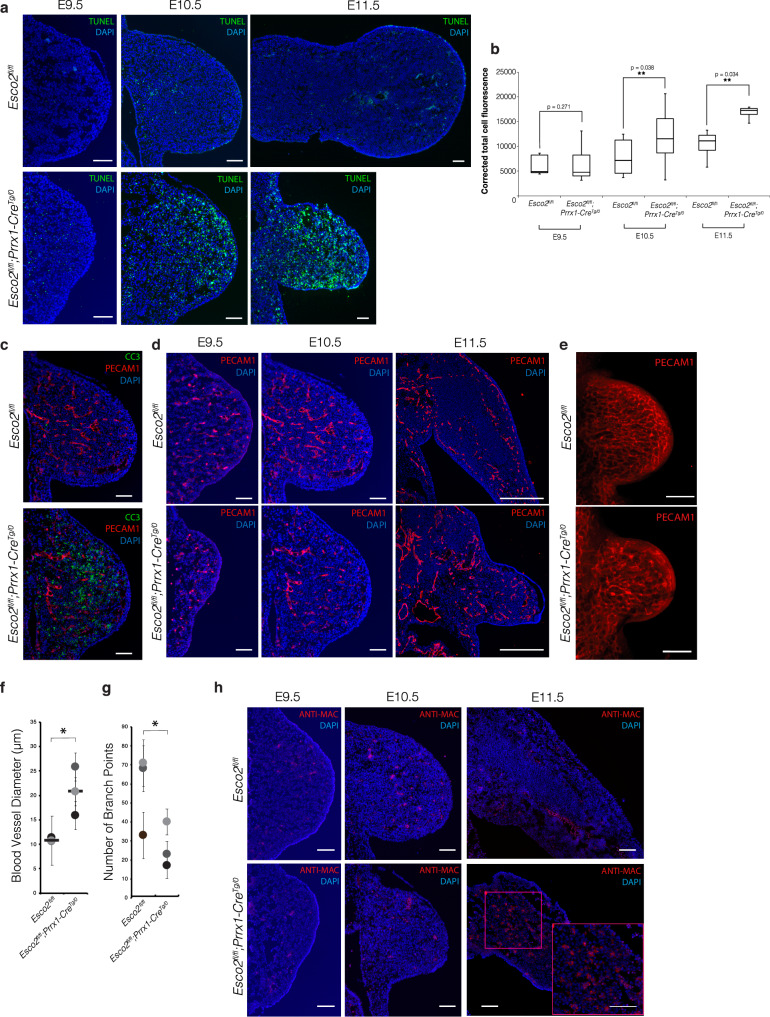
Fig. 5. In vivo validation of differential gene expression from bulk and single-cell RNA-seq analysis.
a TUNEL assay of Esco2fl/fl limb buds (n = 3) and Esco2fl/fl;Prrx1-CreTg/0 limb buds (n = 3) from E9.5-E11.5 in the coronal plane. Scale bar: 100 µm. b Corrected total cell fluorescence (CTCF) of TUNEL+ signal between Esco2fl/fl and Esco2fl/fl;Prrx1-CreTg/0 limbs at E9.5, E10.5 and E11.5. n = 4 for Esco2fl/fl and Esco2fl/fl;Prrx1-CreTg/0 limb buds at E9.5, n = 5 for each genotype at E10.5, and n = 2 for each genotype at E11.5. In each box plot, the center line indicates the median, the edges of the box represent the first and third quartiles, and the whiskers extend to span a 1.5 interquartile range from the edges. Asterisk indicates a significant difference using a one-tailed, Student’s t-test (p ≤ 0.05; p = 0.271, p = 0.038, p = 0.034 for E9.5, E10.5, and E11.5 respectively). c Immunofluorescent staining of Esco2fl/fl (n = 3) and Esco2fl/fl;Prrx1-CreTg/0 (n = 3) limb buds at E10.5 (coronal plane) with cleaved-caspase 3 (CC3) and PECAM1. All samples were co-stained with DAPI. Scale: 100 µm. d Immunofluorescent staining of Esco2fl/fl (n = 3) and Esco2fl/fl;Prrx1-CreTg/0 (n = 3) limb buds at E9.5 (coronal plane), E10.5 (coronal plane) and E11.5 (transverse plane) with PECAM1. All samples were co-stained with DAPI. Scale: 200 µm. e Whole mount immunofluorescent staining of Esco2fl/fl and Esco2fl/fl;Prrx1-CreTg/0 limb buds at E10.5. Scale: 20 mm. f Average blood vessel diameter (µm) of Esco2fl/fl (n = 3) and Esco2fl/fl;Prrx1-CreTg/0 (n = 3) limb buds at E10.5. Littermate pairs are color matched by gray-scale. Data shown are the average measurements from each sample with mean ± SD. Black bar indicates median. Asterisk indicates a significant difference using a one-tailed, Student’s t-test (p ≤ 0.05; p = 0.013). g Number of branch points per sample of Esco2fl/fl (n = 3) and Esco2fl/fl;Prrx1-CreTg/0 (n = 3) limb buds at E10.5. Littermate pairs are color matched by gray-scale. Data shown are the total measurements from each sample with mean ± SD. Asterisk indicates a significant difference using a one-tailed, Student’s t-test (p ≤ 0.05; p = 0.047). h Immunofluorescent staining of Esco2fl/fl (n = 3) limb buds and Esco2fl/fl;Prrx1-CreTg/0 (n = 3) limb buds from E9.5–E11.5 with Anti-macrophage in the coronal plane. Scale: 100 µm. All samples were co-stained with DAPI. Magenta box delineates region with high density of macrophages, magnified in bottom right corner. Source data for 5b, 5f, and 5 g are provided with this paper.

