
Figure 3. Development of the Postacute Sequelae of SARS-CoV-2 Infection (PASC) Research Index and Threshold for Adolescents (Ages 12 to 17 Years).
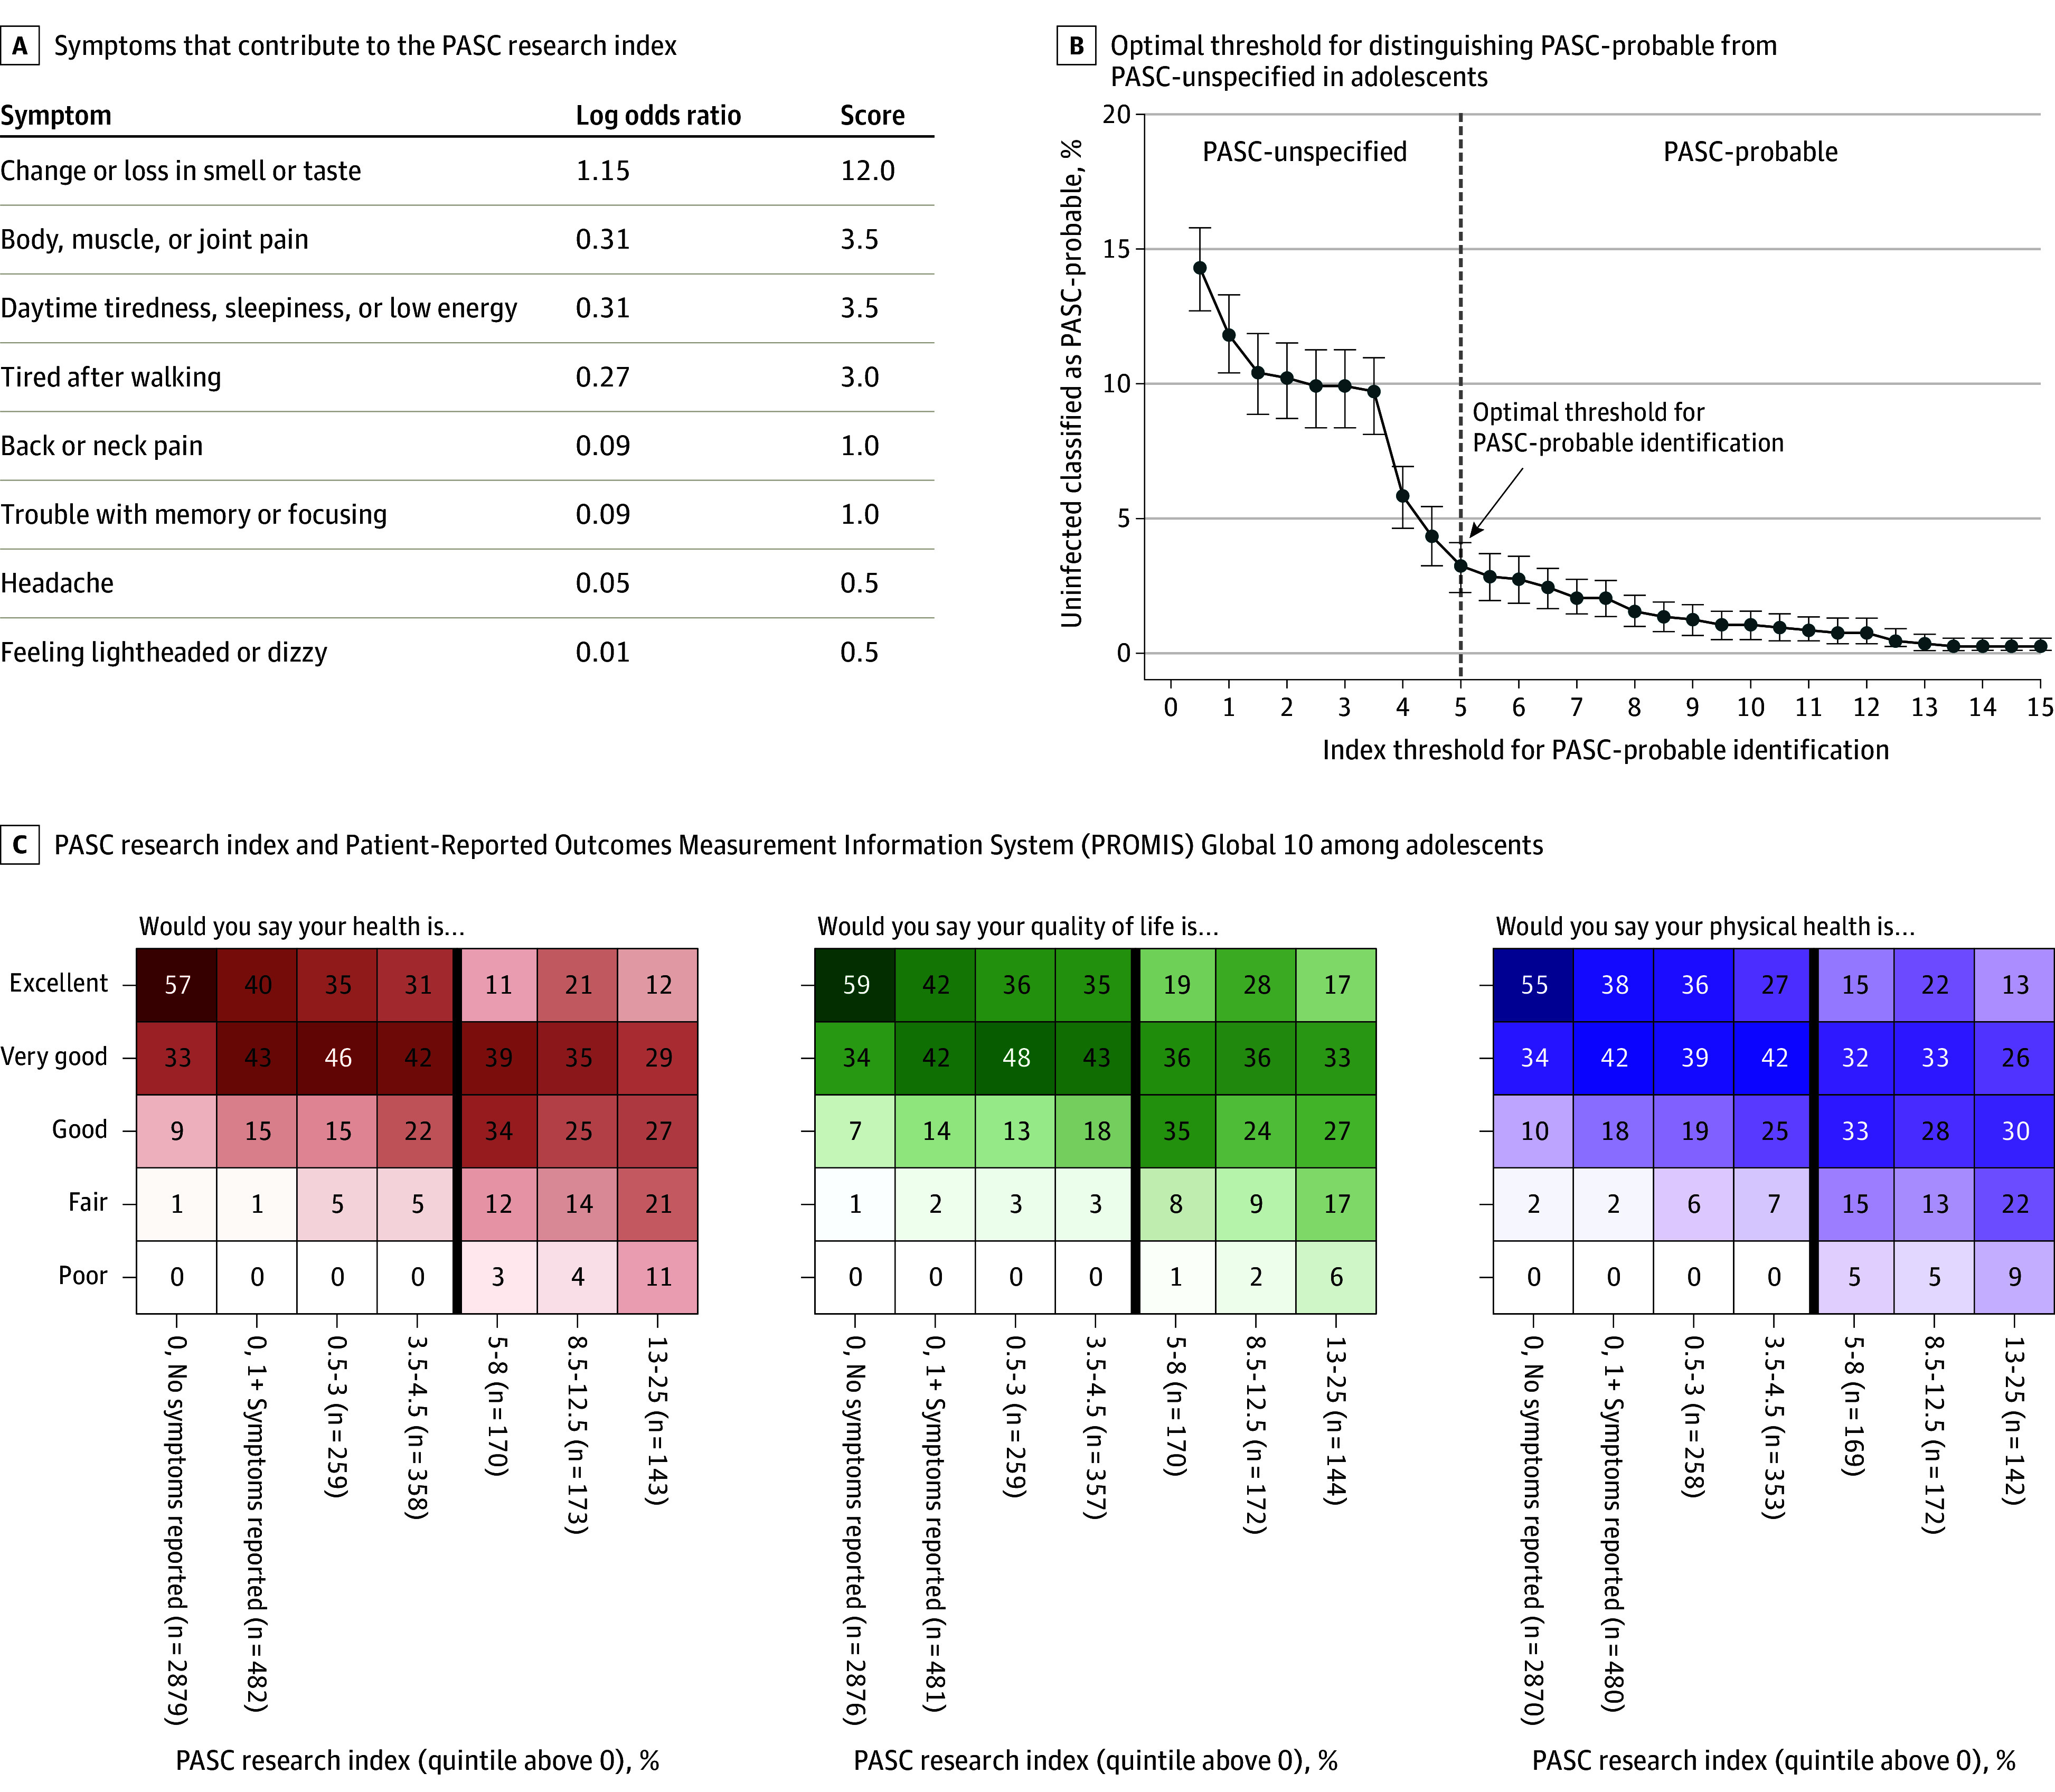
A, Least absolute shrinkage and selection operator (LASSO) was used to fit a logistic regression model to identify which symptoms could be used to identify individuals likely to have PASC. Estimated log odds ratios were divided by 0.10 and rounded up to the nearest 0.5 to calculate symptom scores. An individual’s PASC research index is calculated by summing the scores for each prolonged symptom a participant reported (ie, the participant experienced the symptom for 4 weeks since the beginning of the pandemic and is currently experiencing it at the time of the survey). B, The optimal index threshold for PASC was selected using 95% CIs to estimate error bars. An approximation of the “elbow” method was used to identify the cutoff where the number of uninfected participants misclassified as PASC-probable stabilized (eMethods in Supplement 3). The threshold (index of at least 5) can be used to identify adolescents with PASC for research purposes. Using this threshold, the percentage of infected PASC-probable adolescents with each symptom was as follows: daytime tiredness/sleepiness or low energy, 80%; body, muscle, or joint pain, 61%; headache, 56%; trouble with memory or focusing, 47%; tired after walking, 42%; back or neck pain, 40%; feeling lightheaded or dizzy, 39%; and change or loss in smell or taste, 34%. C, Participant responses to 3 questions from the Patient-Reported Outcomes Measurement Information System (PROMIS) Global 10 survey, stratified into 7 groups: participants with a zero PASC research index and no prolonged symptoms, zero PASC research index but at least 1 prolonged symptoms, and participants with nonzero PASC index, divided into quintiles. The dark vertical line indicates the index threshold for PASC (to the left is PASC-unspecified, to the right is PASC-probable). Each cell is shaded according to the frequency of each response within each column, ranging from 0% to 100%.