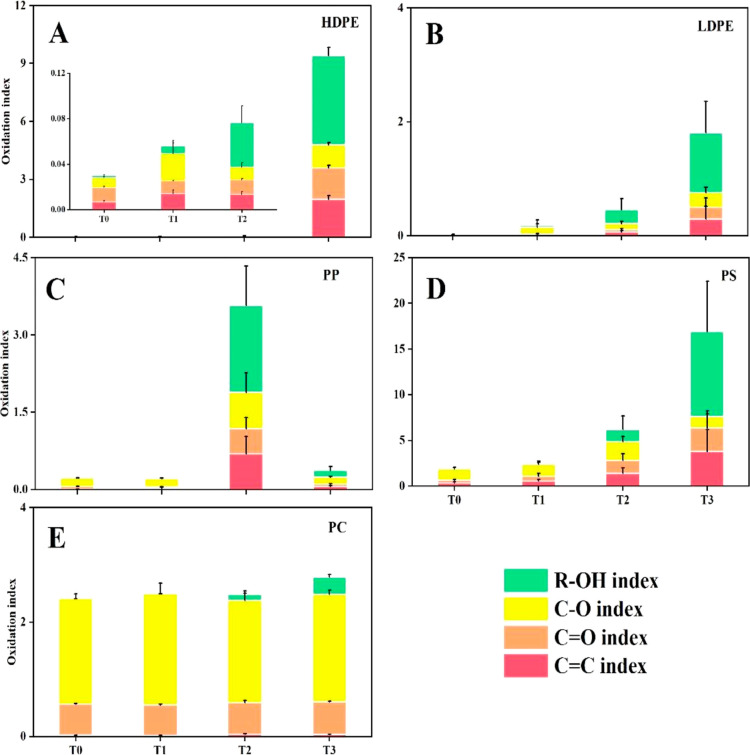
Figure 1.
Oxidation indices of HDPE (A), LDPE (B), PP (C), PS (D), and PC (E) from laboratory weathering experiments. T0–T3 represents 0–9 months of weathering, and indices of different functional groups were from the FTIR analysis. Data are the averages of six replicate measurements; error bars represent the standard deviations.

