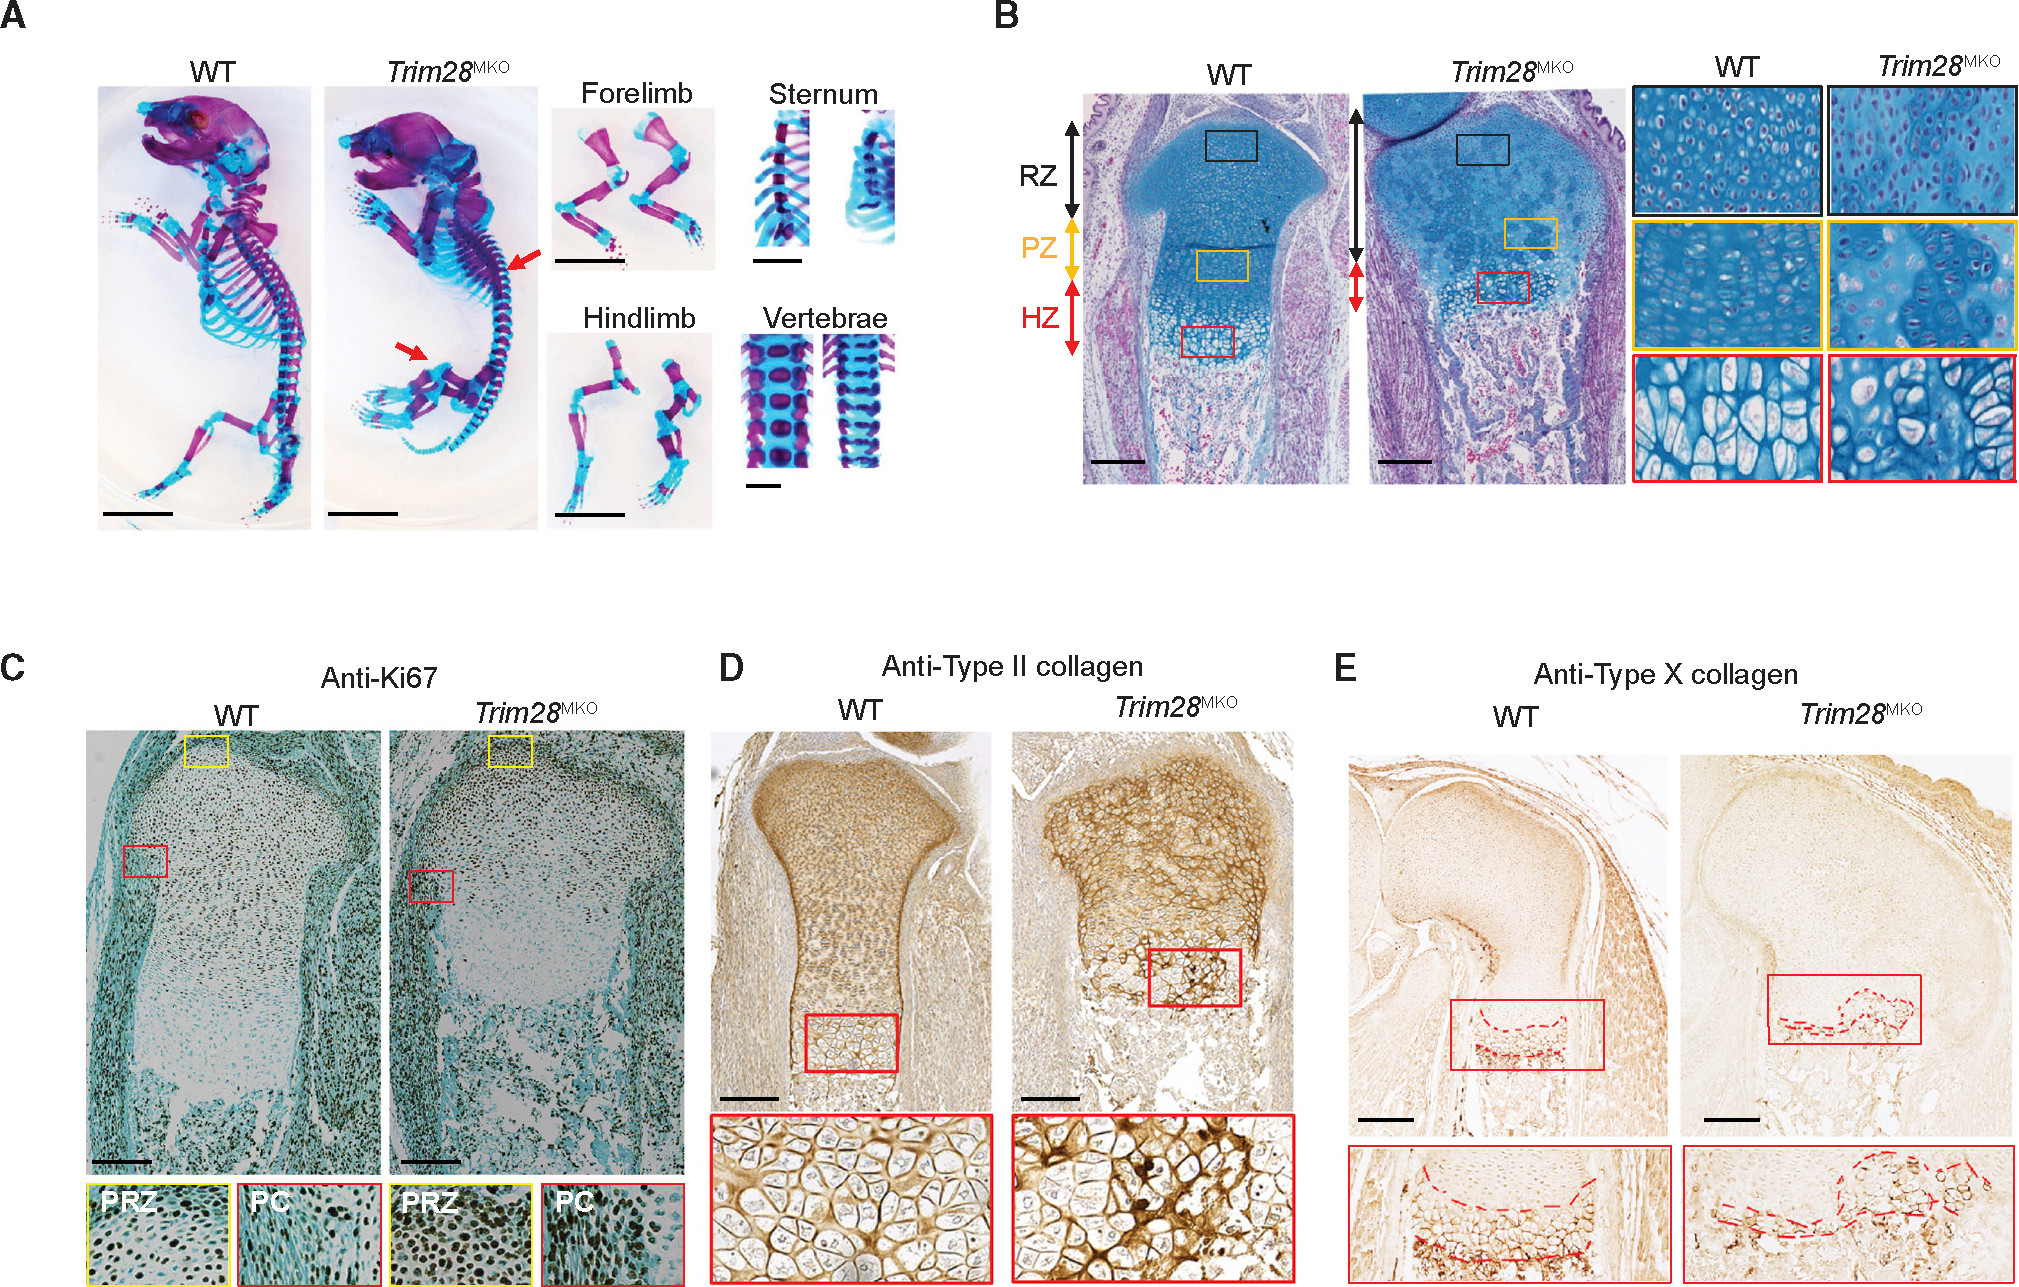
Figure 1. TRIM28 loss in mesodermal cells disrupts skeletal development.

(A) Skeletal phenotypes of WT and Trim28MKO mice at E19.5 visualized with Alcian blue and Alizarin red staining; arrowheads indicate thicker and shorter ribs and over-expanded hindlimb cartilage. Scale bar, 0.5 cm.
(B) E17.5 mouse proximal tibial sections stained with Alcian blue Hematoxylin/Orange G. Gross image (left) and magnified views of each zone (right) are shown(RZ, resting zone; PZ, proliferating zone; HZ, hypertrophic zone). Scale bar, 200 μm.
(C) Increased cell proliferation in the Trim28MKO proximal tibial sections (E17.5) as indicated by Ki67 immunohistochemistry (IHC). Bottom panel: area boxed in red is the magnified perichondrium (PC), while the yellow boxed area is the magnified periarticular resting zone (PRZ). Scale bars, 200 μm.
(D) Type II collagen IHC of proximal tibial sections (E17.5). Area boxed in red is magnified in the bottom panels showing high levels of type II collagen retention inthe Trim28MKO HZ. Scale bars, 200 μm.
(E) Type X collagen IHC staining of distal femoral sections (E17.5). The red box area is magnified in the bottom panel, and red dotted lines define type X collagen-expressing areas. Scale bars, 200 μm.
See also Figure S1.
