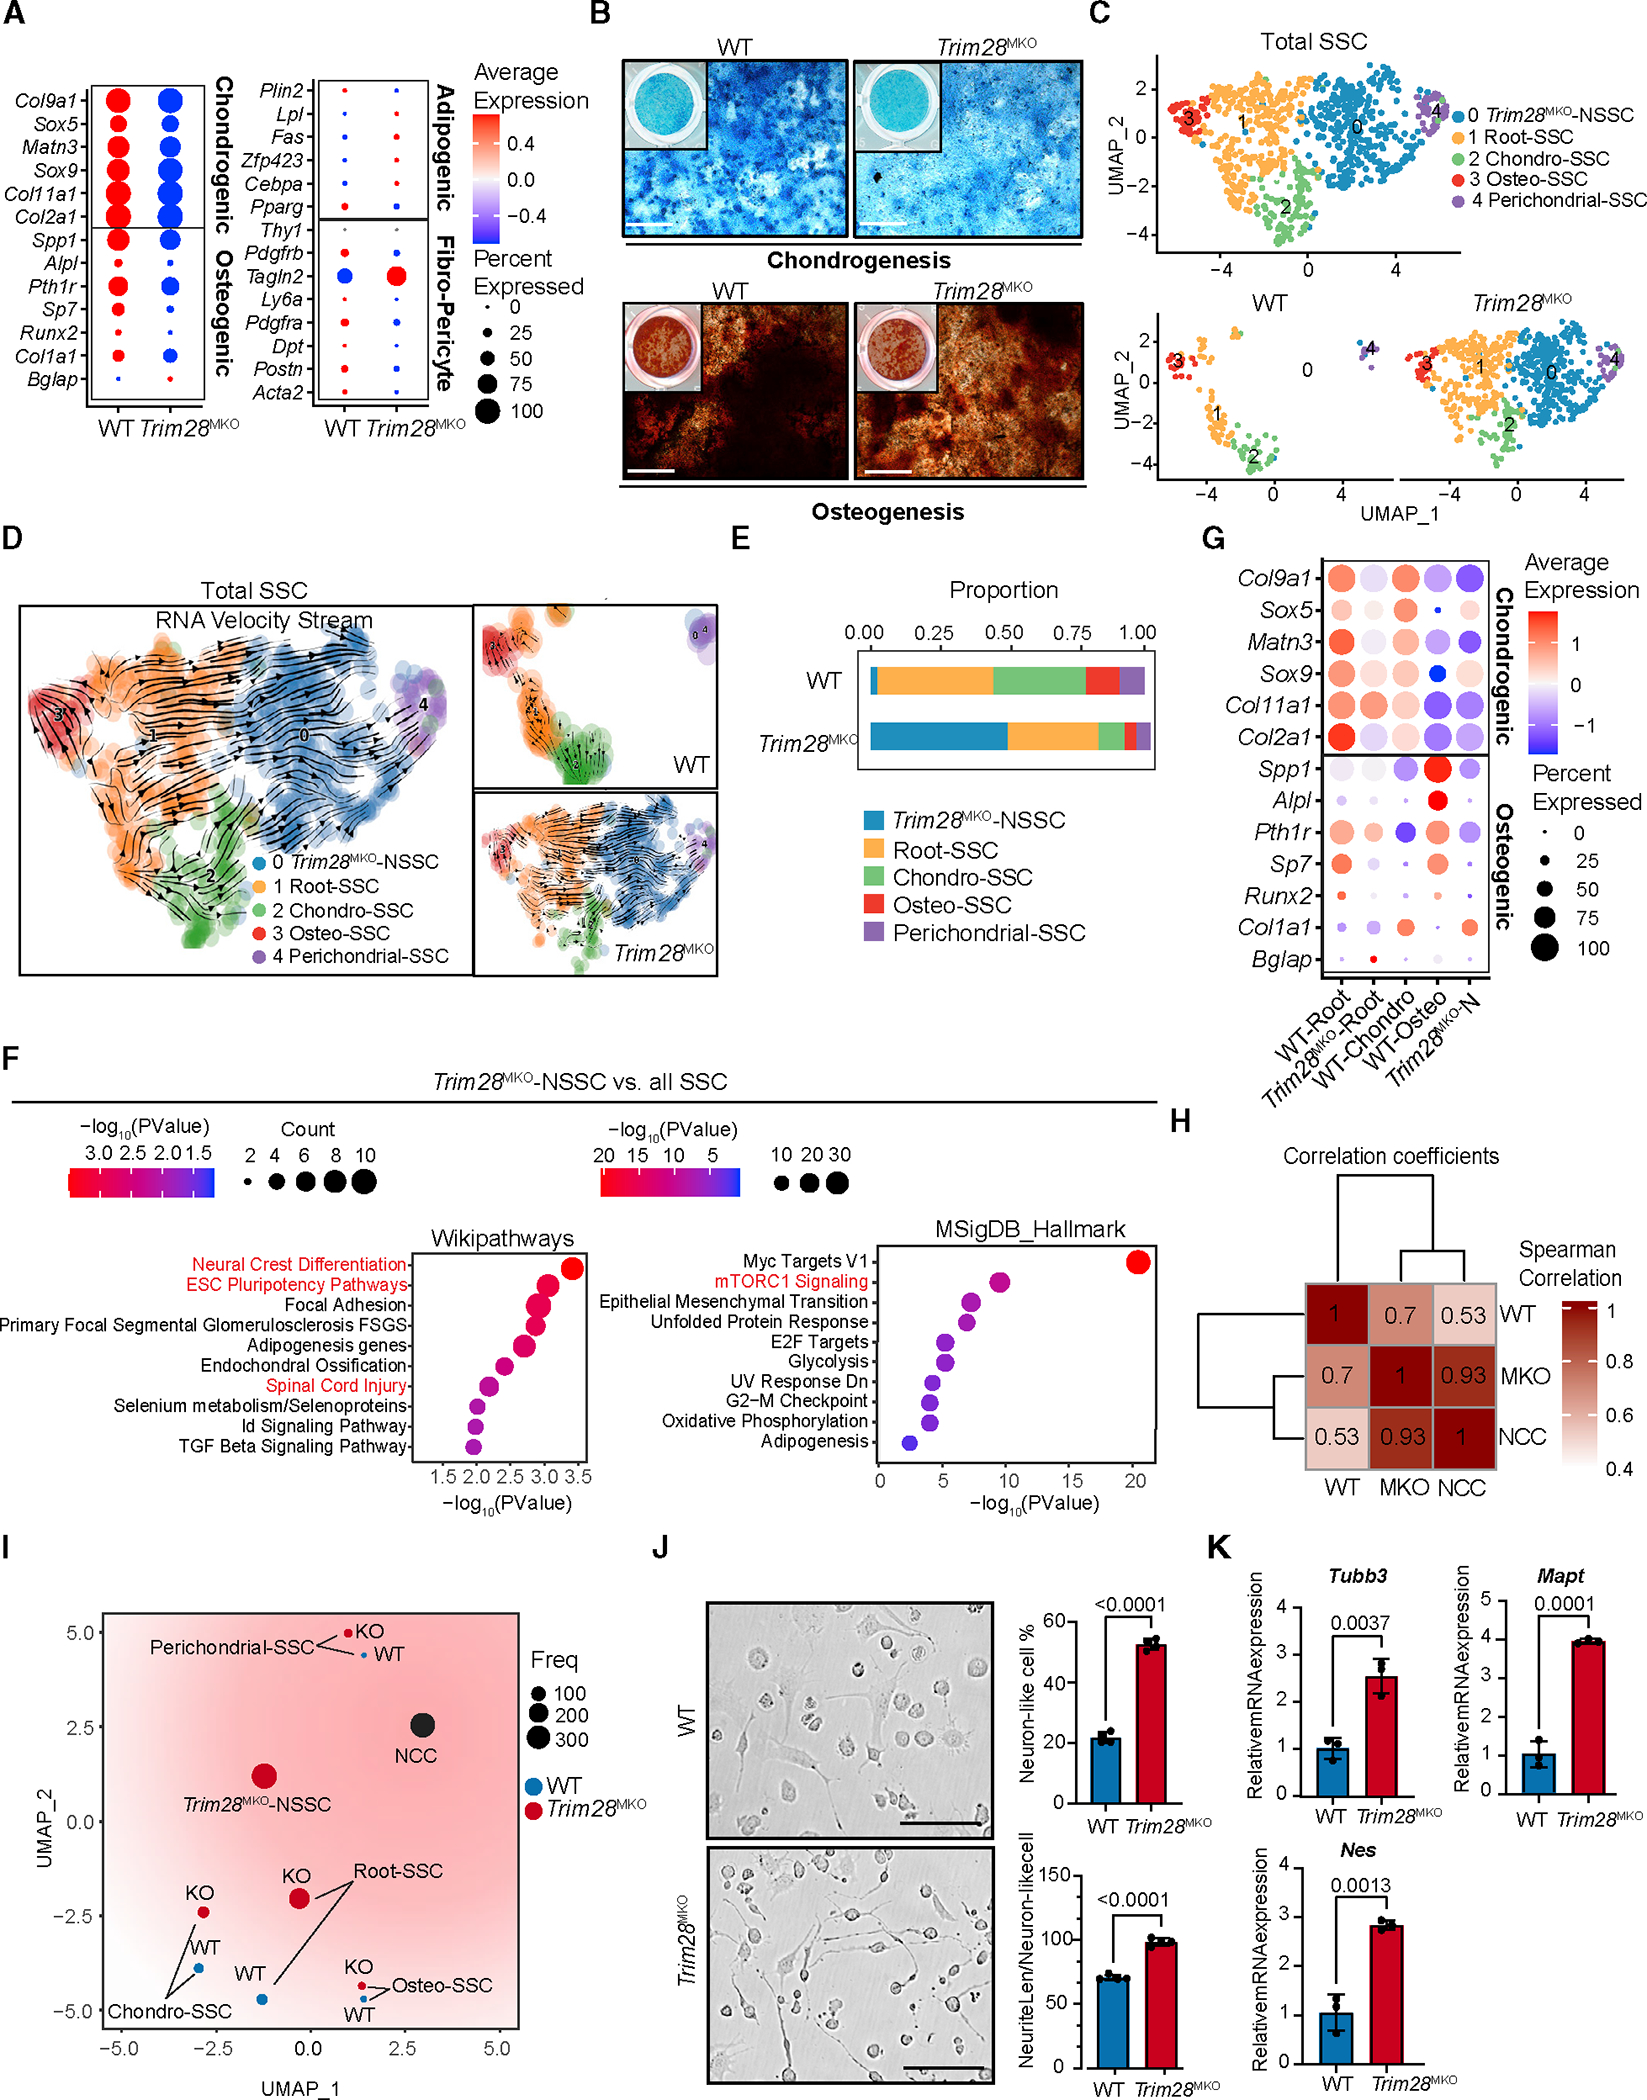
Figure 3. Loss of TRIM28 endows SSCs with neural crest cell-like prosperities while impairing osteochondrogenesis.

(A) Dot plots comparing the expression of selected lineage/niche markers in total WT SSCs versus Trim28MKO SSCs.
(B) Ex vivo chondrogenesis (top panels) and osteogenesis (bottom panels) of FACS WT or Trim28MKO GP SSCs. Representative staining is shown (n = 3 per genotype). Scale bar, 400 μm.
(C) UMAP of 5 subclusters of SSCs from combined WT and Trim28MKO hindlimb GP cells (top panel). Genotype-specific UMAPs of SSCs are shown in the bottom panels.
(D) RNA velocity trajectory inference analysis of gross SSCs (left). The separated WT (top panel) and Trim28MKO (bottom panel) velocity trajectories are shown on the right.
(E) Proportion of each SSC subtype in WT or Trim28MKO GP SSCs.
(F) Enriched WiKiPathways and MSigDB_Hallmarks in Trim28MKO-NSSCs versus all SSCs (WT plus Trim28MKO).
(G) Dot plots comparing the expression of osteochondrogenic marker genes in WT and Trim28MKO root-SSCs, Trim28MKO-NSSCs, WT chondro- and osteo-SSCs.
(H) Transcriptomic profiles of Trim28MKO SSCs (MKO), but not WT SSCs (WT), show a strong similarity with neural crest cells (NCCs) according to Spearman correlation analysis.
(I) Pseudo-bulk-level transcriptomic similarity analysis of NCC and SSC subtypes. The size of dots represents the cell number of each subcluster.
(J) FACS Trim28MKO GP SSCs exhibit more potent neurogenic differentiation than WT SSCs. Representative bright-field images are shown in the left panels, and percentages of neuron-like cell/total cell and neurite length/neuron-like cell are quantified in the right panel (n = 4 per genotype). Scale bar, 100 μm. p < 0.0001. Data comparisons are conducted by Student’s t test, two-tailed. Data are presented as mean ± SEM.
(K) Trim28MKO SSCs express higher levels of neurogenic markers than WT SSCs after 5 days of neurogenic induction (n = 3 per genotype). p values are shown in the figure. Data comparisons are conducted by Student’s t test, two-tailed. Data are presented as mean ± SEM. See also Figures S3 and S4 and Table S2.
