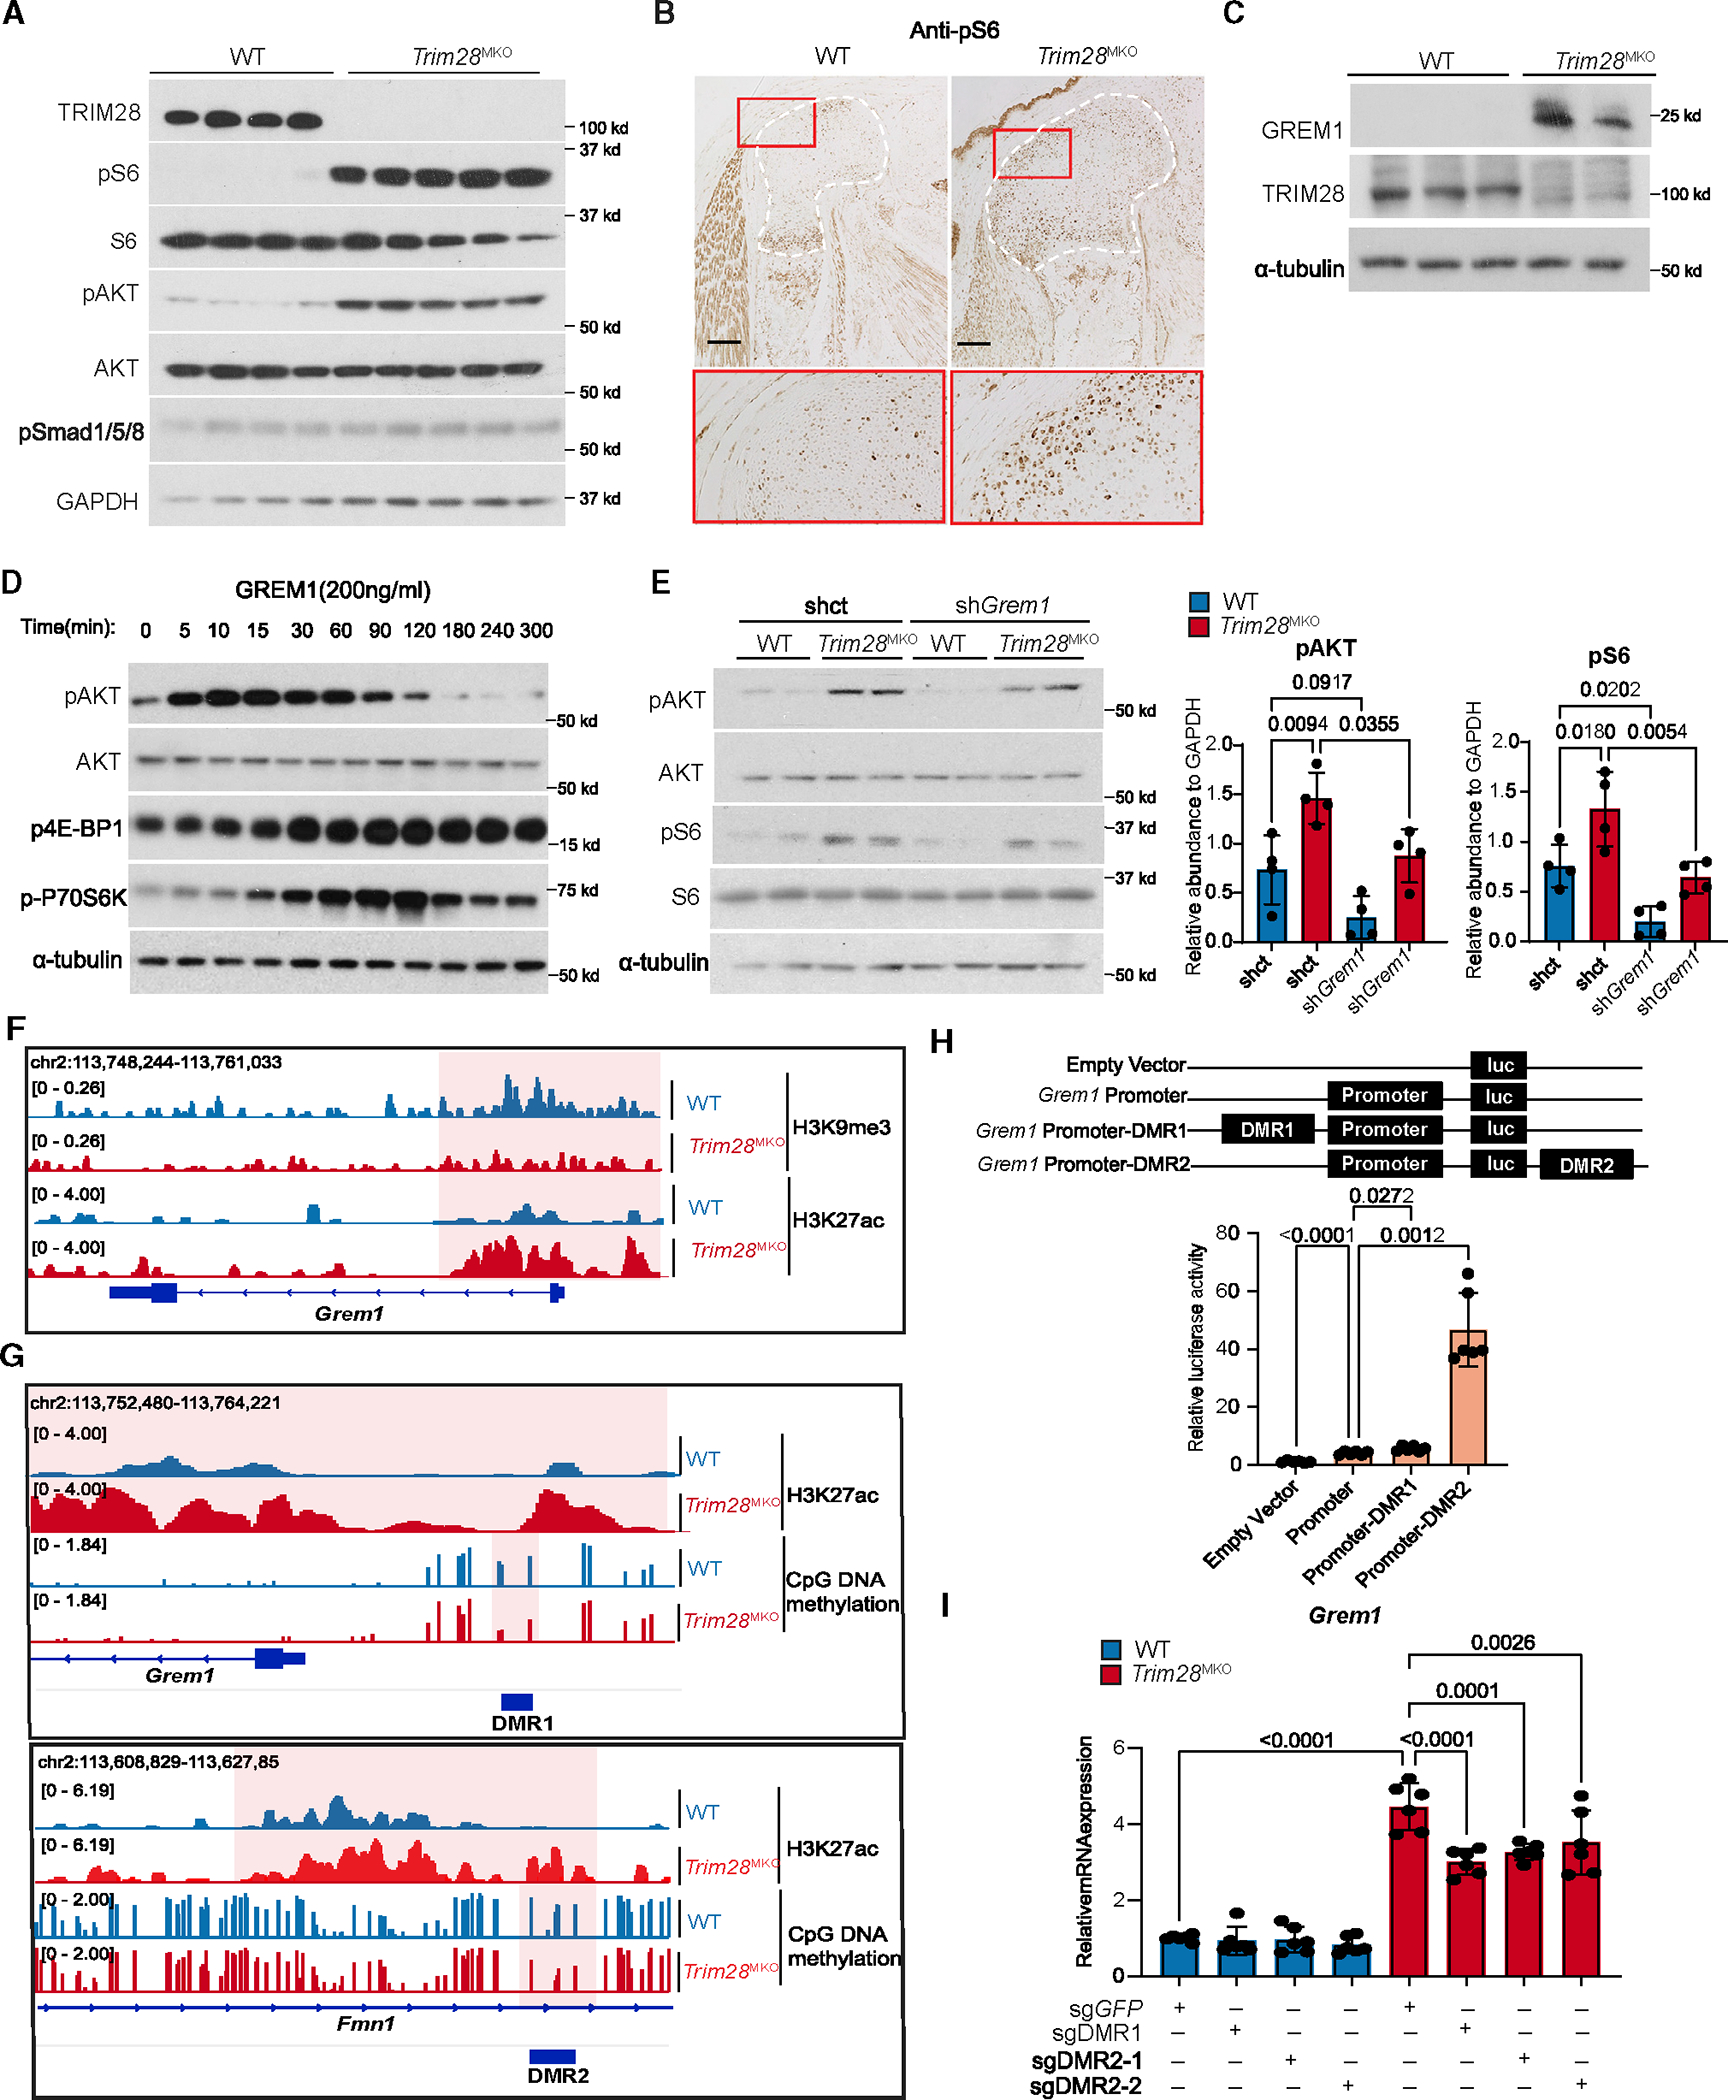
Figure 5. TRIM28 epigenetically silences Grem1 expression to suppress PI3K-AKT-mTORC1 signaling.

(A) pS6 (an mTORC1 downstream effector) and pAKT (an mTORC1 upstream activator) levels are increased in E17.5 Trim28MKO rib GPs (WT, n = 4; Trim28MKO, n = 5).
(B) pS6 level is increased in E17.5 Trim28MKO mouse distal femur. GP areas are demarcated by white dashed lines. Red boxes are magnified in the bottom panel. Scale bars, 200 μm.
(C) GREM1 and TRIM28 protein expressions are inversely related in the rib GP cells (WT, n = 3; Trim28MKO, n = 2).
(D) mTORC1 and AKT pathways are activated by recombinant GREM1 in ATDC5 cells in a time-dependent manner.
(E) Levels of pAKT and pS6 were reduced by Grem1 gene knockdown with shRNA targeting Grem1 (shGrem1) in cultured Trim28MKO rib GP cells compared with control shRNA (shct). Densitometry quantification (n = 4) is shown on the right. p values are shown in the figure. Comparisons are conducted using one-way ANOVA analyses with Tukey’s post-hoc test. Data are presented as mean ± SEM.
(F) H3K27ac and H3K9me3 marks at the promoter region of the Grem1 gene.
(G) The occupancy status of CpG DNA methylation and H3K27ac at DMR1 and DMR2. The most distinctive changes are highlighted, and DMR regions are indicated with dark blue bars.
(H) Luciferase reporter assays indicating the transcriptional activity of the Grem1 enhancers (DMR1 or DMR2) and promoter in ATDC5 cells. Schematics of the reporter constructs are in the top panel. Empty pGL3-basic vector was used as a negative control. Representative quantified results are shown in the bottom panel (n = 6). p values are shown in the figure. Comparisons are achieved using Student’s t test, two-tailed. Data are presented as mean ± SEM.
(I) Grem1 mRNA levels in control (sgGFP) and CRISPR-Cas9-mediated DMR1 (sgDMR1) or DMR2 (sgDMR2–1, sgDMR2–2) deleted WT and Trim28MKO rib GP cells (n = 6). p values are shown in the figure. Comparisons are conducted using one-way ANOVA analyses with Tukey’s post-hoc test. Data are presented as mean ± SEM.
See also Figure S5.
