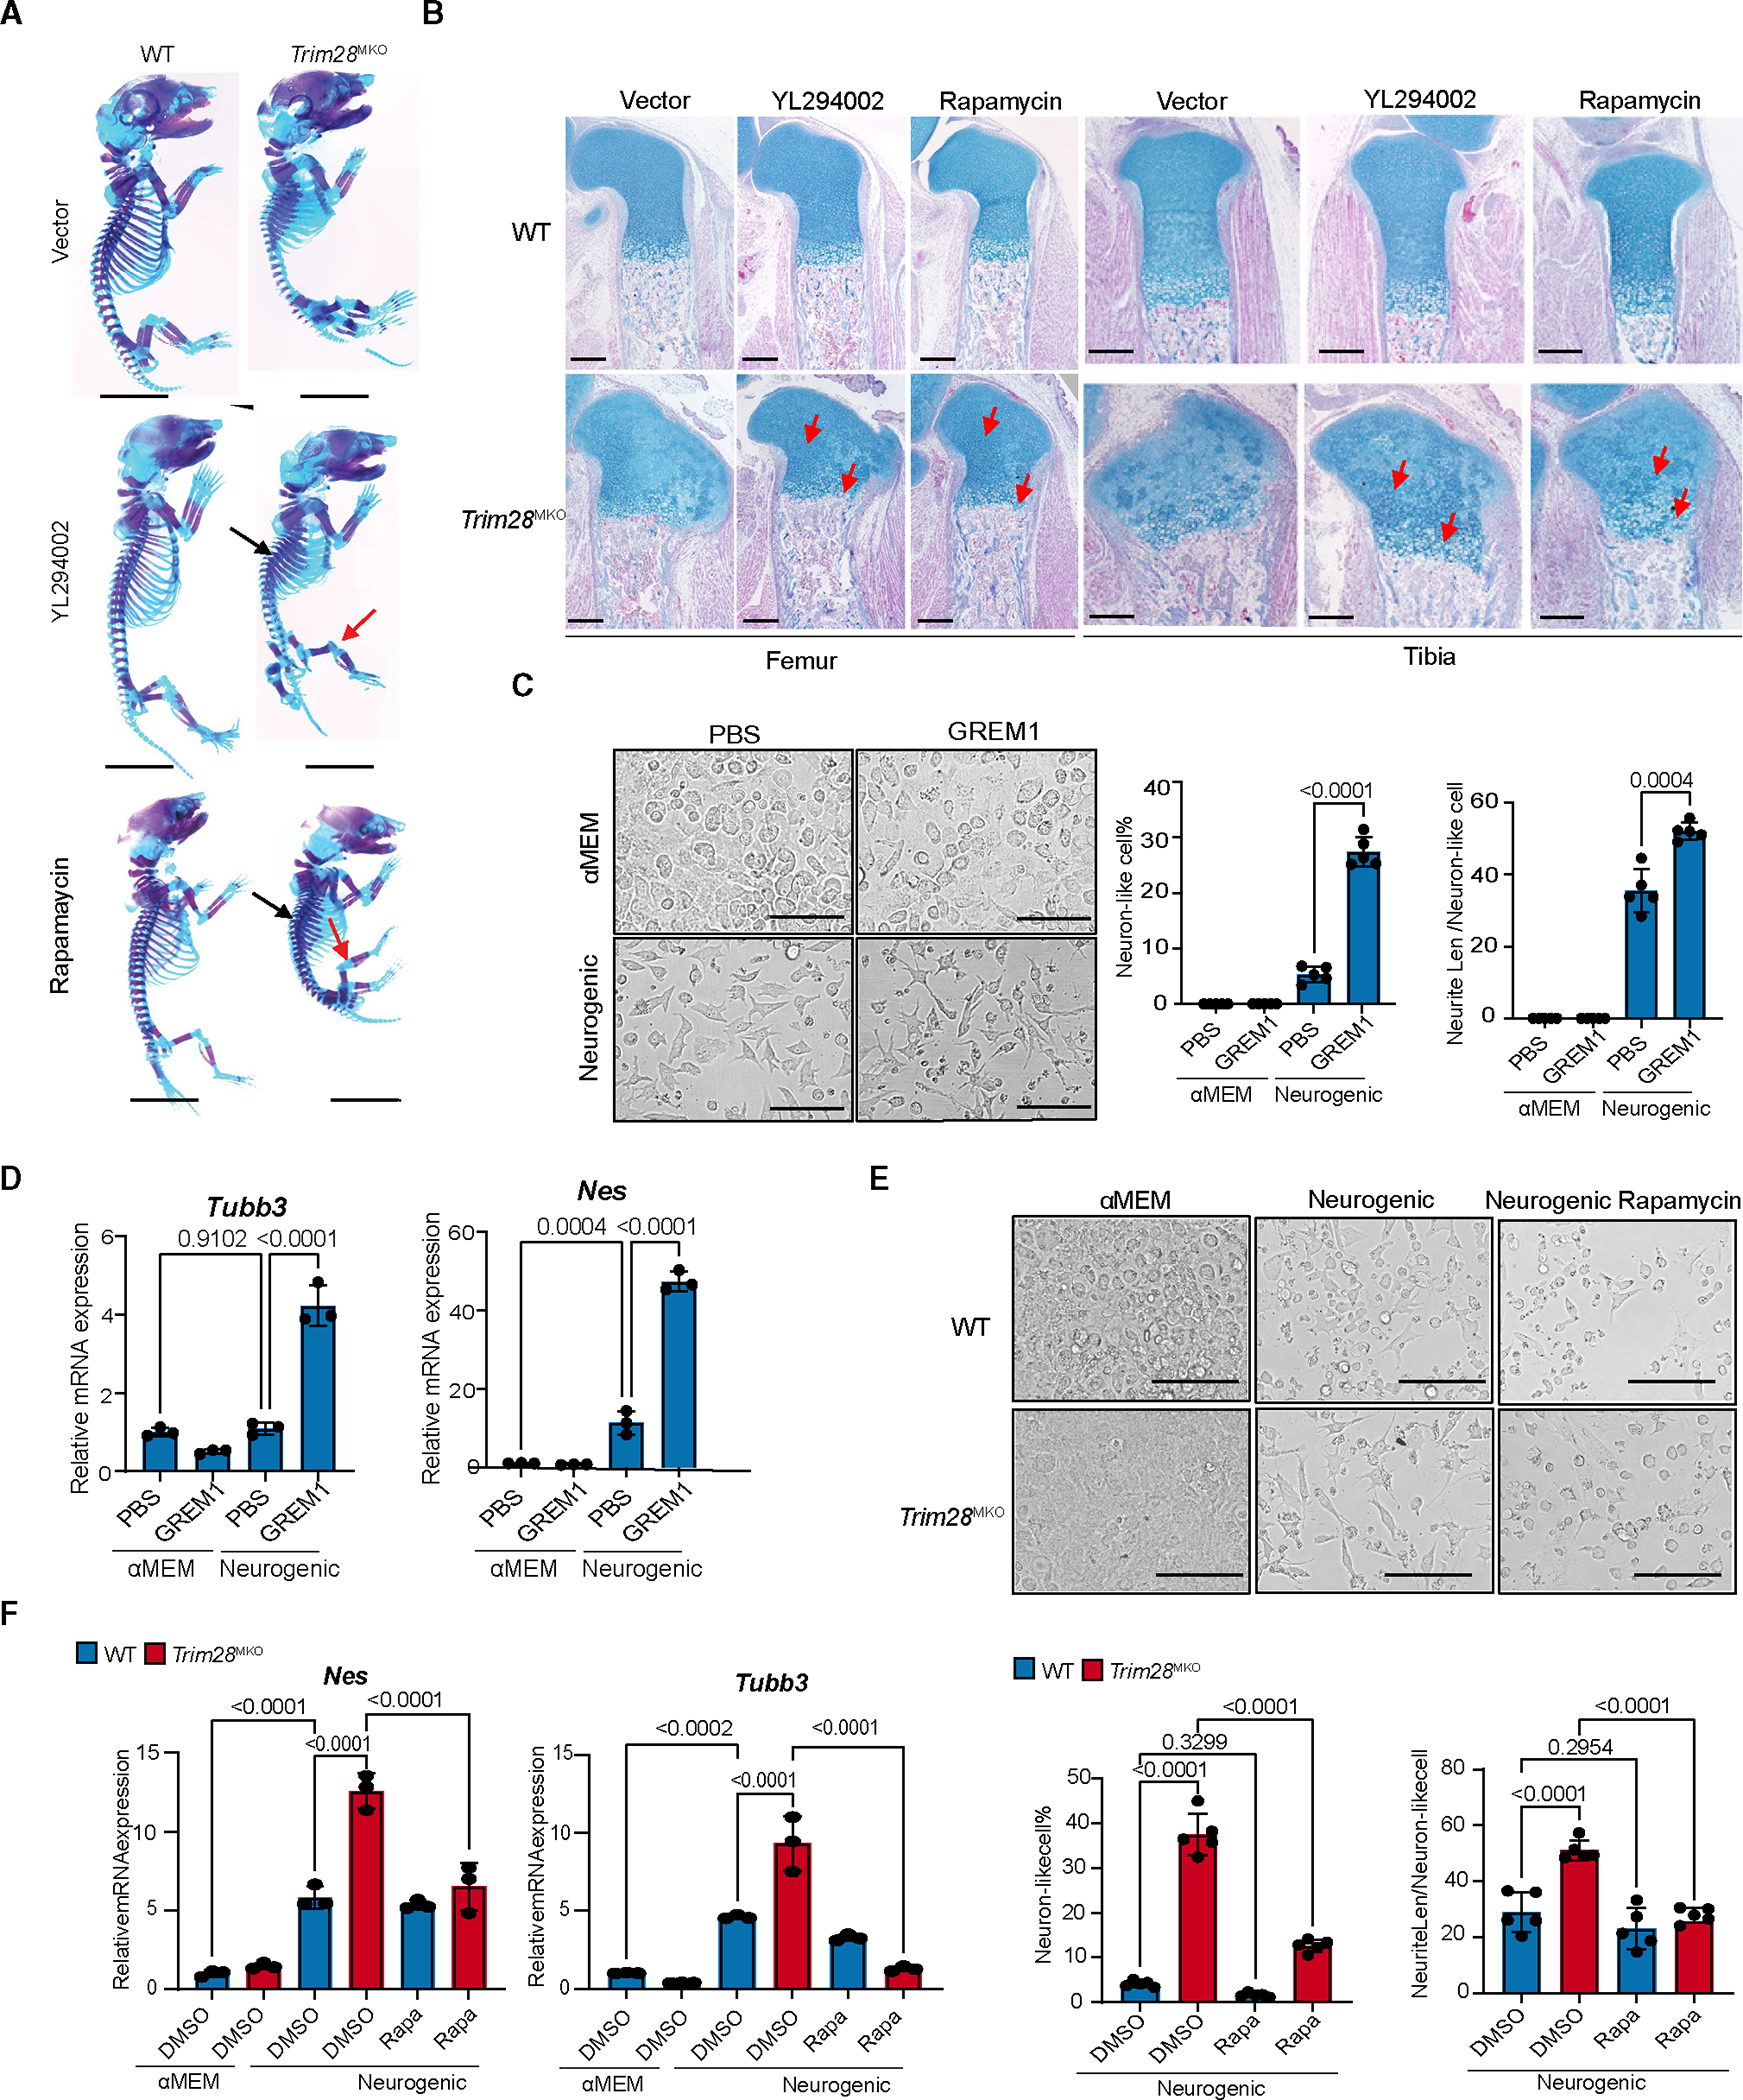
Figure 6. Hyperactivated GREM1-PI3K-AKT-mTORC1 signaling contributes to the skeletal defects of Trim28MKO mice.

(A) Skeletal phenotypes of the E17.5 vector-, YL294002-, or rapamycin-treated mice visualized with Alcian blue and Alizarin red staining. Red arrows indicate reduced knee cartilage and black arrows indicate expanded rib cages in YL294002-and rapamycin-treated mice. Scale bars, 0.5 cm.
(B) Representative Alcian blue Hematoxylin/Orange G stain of proximal tibial (right) and distal femoral (left) sections from mice treated with vector, YL294002, and rapamycin. Red arrows indicate rescued proliferating and hypertrophic zones. Scale bars, 200 μm.
(C) Ex vivo neurogenesis of GP cells isolated from WT hindlimb treated with either GREM1 (300 ng/mL) or PBS in either neurogenic media or αMEM (n = 5 per group). p values are shown in the figure. Comparisons are achieved by one-way ANOVA analyses with Tukey’s post-hoc test. Data are presented as mean ± SEM. Scale bars, 100 μm.
(D) Expression of key neurogenic markers (n = 3 per group) in cells cultured as described in (C). p values are shown in the figure. Comparisons are achieved by one-way ANOVA analyses with Tukey’s post-hoc test. Data are mean ± SEM.
(E) Rapamycin (100 nM) treatment partially rescues the enhanced neurogenesis of hindlimb GP cells caused by Trim28 loss. DMSO was used as a negative control (n = 5 per group). p values are shown in the figure. Comparisons are achieved by one-way ANOVA analyses with Tukey’s post-hoc test. Data are presented as mean ± SEM. Scale bars, 100 μm.
(F) mRNA expression of key neurogenic markers from cells treated as described in (E) (n = 3 per group). p values are shown in the figure. Comparisons are achieved by one-way ANOVA analyses with Tukey’s post-hoc test. Data are presented as mean ± SEM.
