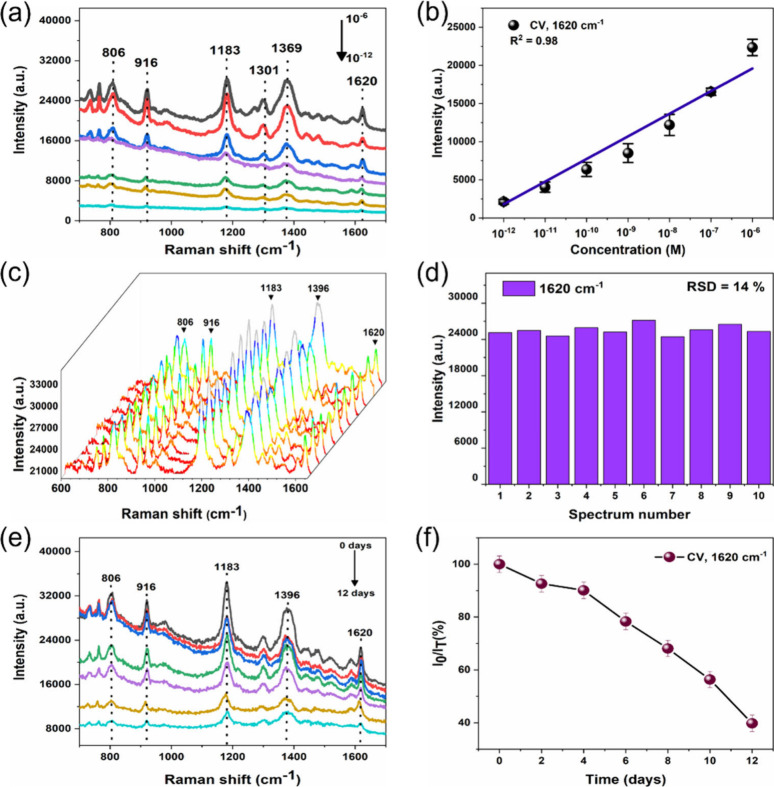
Figure 5.
(a) SERS spectrum of the test CV molecules onto a nanoporous Ag NP film substrate with varying CV concentrations between 10–6 and 10–12 M. (b) Linear calibration corresponding to the Raman peak of 1620 cm–1 vs concentrations of CV. (c) SERS spectra of CV (10–6 M) recorded from 10 randomly selected spots on the nanoporous Ag NP substrate. (d) Distribution of peak intensity at 1620 cm–1 for 10 different spots. (e) Raman spectra recorded for CV (10–6 M) for a 12 day period. (f) Corresponding changes of the Raman signal intensity of CV at 1620 cm–1.

