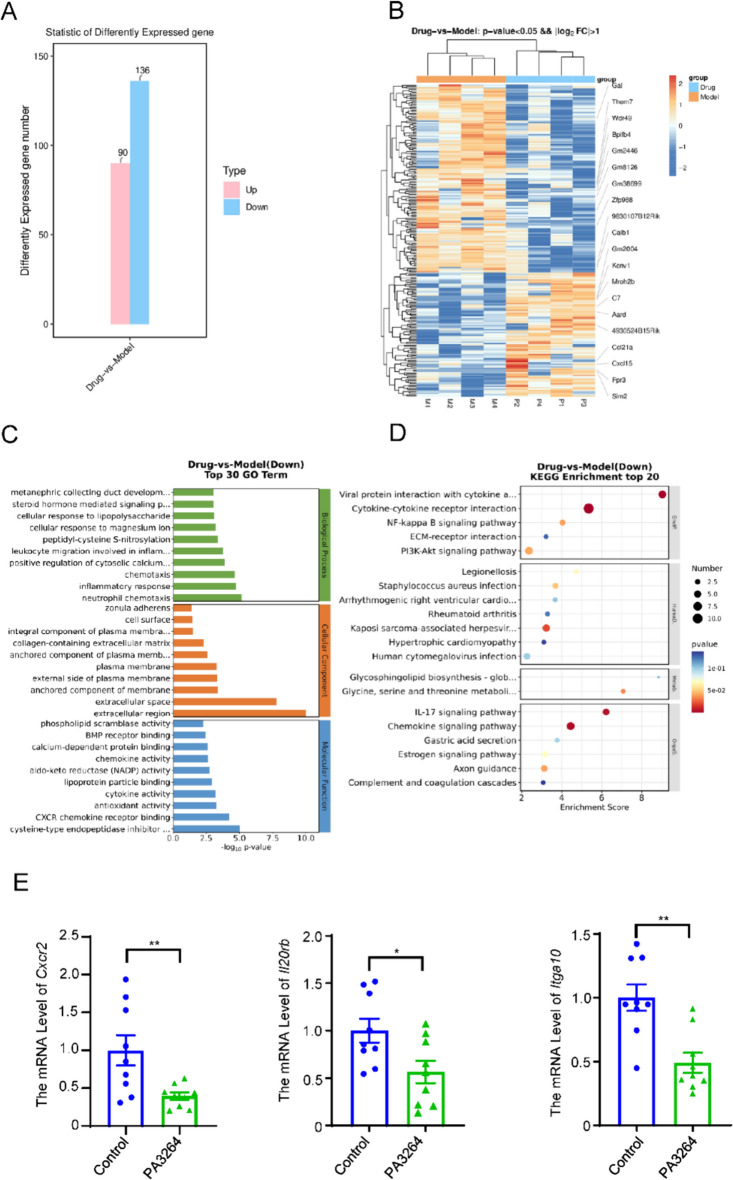
Fig. 5.
RNA-seq analysis of PA3264 in 4T1 orthotopic tumors. A The bar chart showed the number of upgraded or downgraded DEGs in tumors between the control and PA3264-treated groups. B Clustering heatmap analysis of DEGs in different groups using RNA-seq analysis. C GO enrichment analysis of the candidate targets of PA3264 in the treatment. The top 10 GO functional categories were selected. D KEGG pathway enrichment of the candidate targets of PA3264 in treating TNBC. The size of the circles represents the number of genes, and the color represents the p-value. E qRT-PCR verification of DEGs related to the PI3K/AKT signaling pathway. Data were presented as mean ± SEM, n = 9, *p < 0.05, **p < 0.01, ***p < 0.001 vs. the control group

