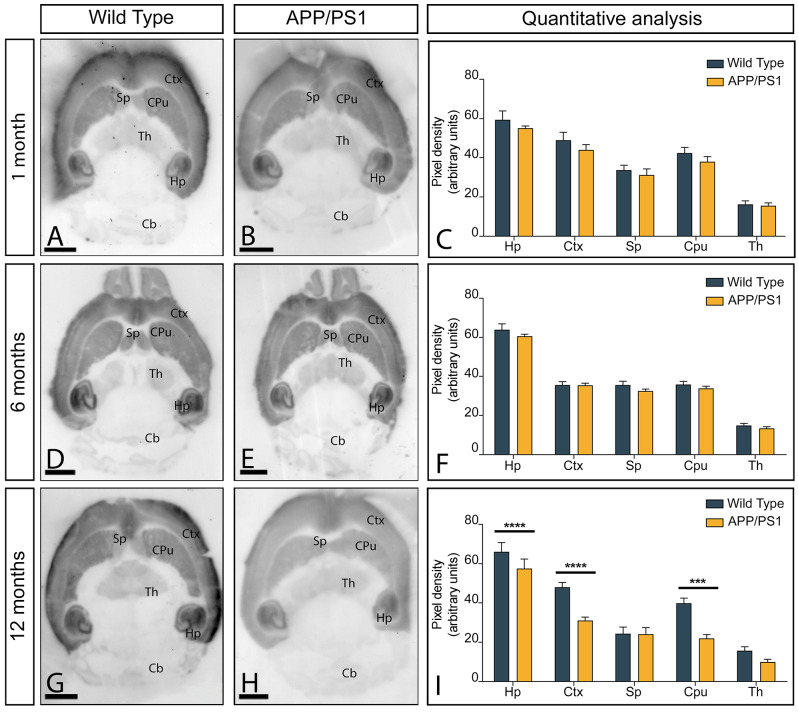
Fig. 1.
Brain expression of NMDARs in APP/PS1 mice. (A-I) The expression of the GluN1 protein was visualised using histoblots of horizontal brain sections at 1, 6 and 12 months of age in wild type and APP/PS1 mice using an affinity-purified anti-GluN1 antibody. Densitometric analysis of scanned histoblots allowed determination of GluN1 expression in different brain regions. The strongest GluN1 expression was detected in the hippocampus (Hp), followed by the cortex (Ctx). Moderate expression levels were detected in the caudate putamen (CPu) and the septum (Sp). The weakest expression levels were found in the thalamus (Th), and the cerebellum (Cb). Densitometry data generated at 1 and 6 months of age showed no differences in GluN1 expression in APP/PS1 mice compared to age-matched wild type controls, but a significant reduction was detected in the hippocampus, cortex and caudate putamen at 12 months of age (Mann-Whitney test, **** P < 0,0001, *** P < 0,001). Error bars indicate SEM. Scale bars: 0.25 cm

