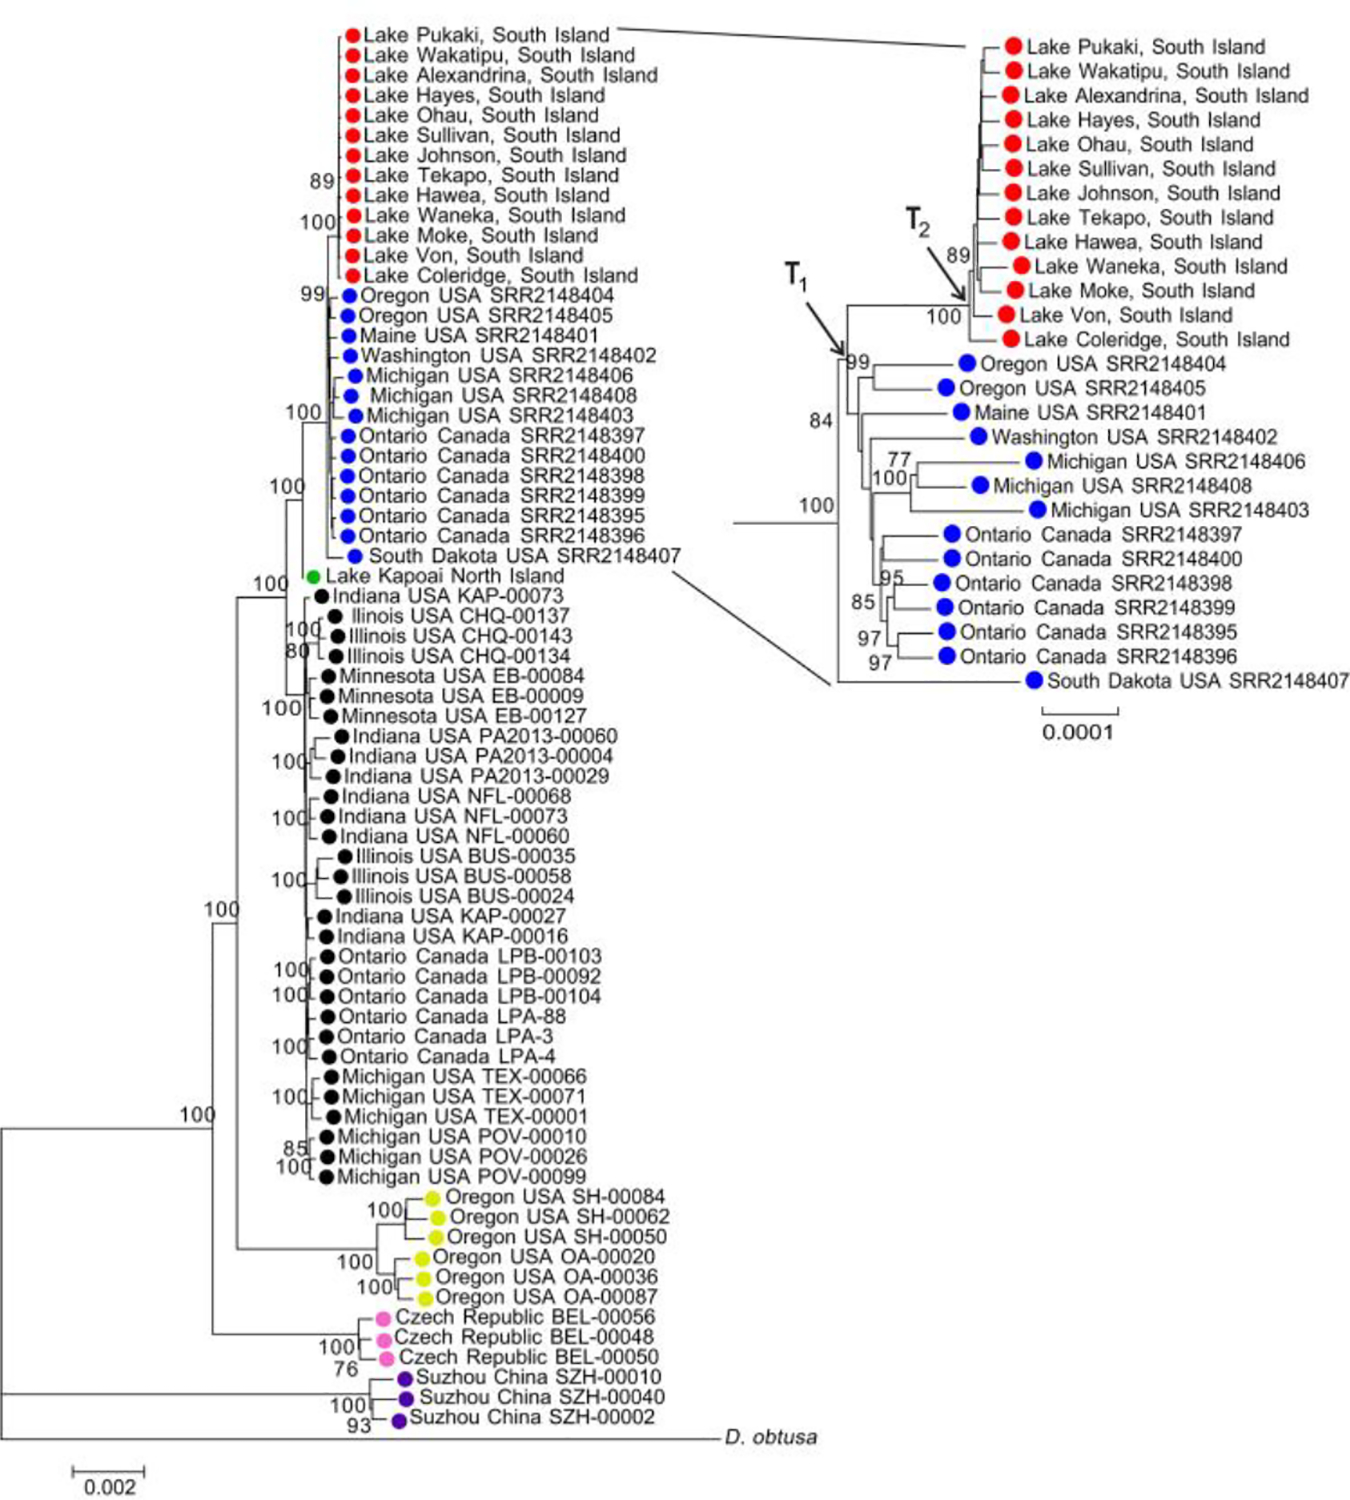
Fig 2.

Maximum likelihood tree using nuclear genome sequences. South Island, New Zealand (NZ) Daphnia samples (red circles); North Island, NZ Daphnia sample (green circle); Daphnia cf. pulex sensu Hebert (black circles); Oregon D. “pulex” (yellow circles); D. pulex Leydig (pink circles), and Chinese D. “pulex” samples (purple circles); Daphnia pulicaria Forbes samples are marked with blue circles. Inset on the right shows the phylogeny of the South Island and North American D. pulicaria Forbes in more detail. Bootstrap values > 75/100 are shown. T1 is the divergence time between the north American and the south Island D. pulicaria Forbes. T2 is the expansion time of South Island D. pulicaria Forbes.
