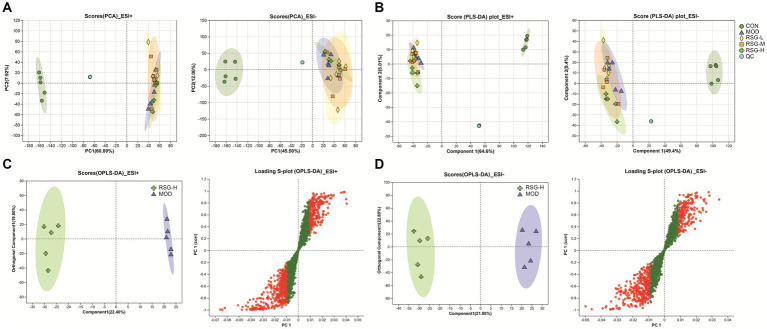
Figure 5.
The fecal metabolome of obese mice treated with RSG extract. (A) PCA score plots of the detected metabolites among CON, MOD, RSG-L, RSG-M, and RSG-H groups. (B) PLS-DA score plots of the detected metabolites among CON, MOD, RSG-L, RSG-M, and RSG-H groups. (C,D) OPLS-DA between the MOD and RSG-H groups. Data from positive ion mode (C) and negative ion mode (D) are depicted.

