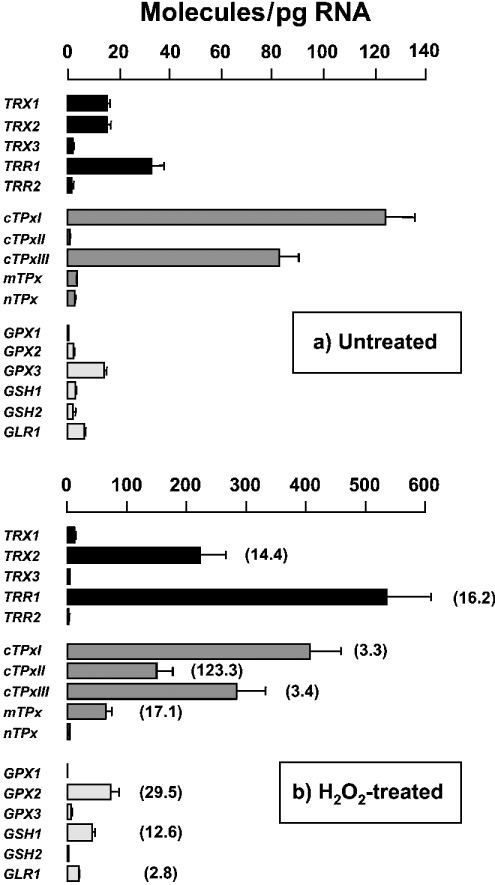
Figure 1. Induction of gene expression by oxidative stress.
Wild-type cells were grown in minimal SD medium to reach an absorbance A600 1 and then treated for 10 min with 100 μM H2O2 (b). Untreated cells served as reference (a). The means±S.E.M. of mRNA molecules/pg of total RNA were plotted for the different genes. Some error bars are not visible because of small S.E.M. values. To facilitate the comparison of relative and absolute quantifications, the data from H2O2-treated cells were divided by those of untreated cells. These fold increments are given in parentheses. Only statistically significant increments are indicated.

