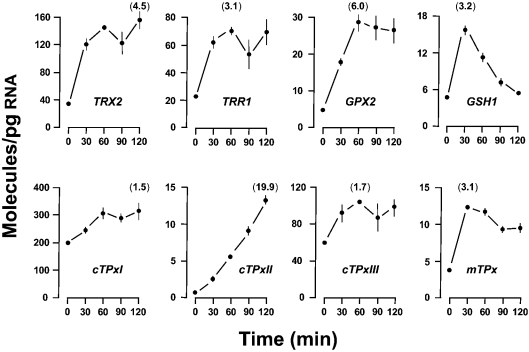
Figure 5. Time-course effect of thiolutin on mRNA levels.
Wild-type cells were grown in YPD medium to reach an A600 0.5. Cells were then treated with 87 μM thiolutin dissolved in DMSO. Samples were collected at the indicated times after drug addition. Results are the means±S.E.M. of mRNA molecules/pg of total RNA. Data at 0 min represent the steady-state levels of solvent control cells. No time-related effect was noted in these control cells. Some error bars are not visible because of small S.E.M. values. All transcripts were quantified, but only those mRNAs for which statistically significant increases were observed at a given thiolutin exposure time are shown. The remaining genes were transcriptionally inhibited by thiolutin, and their mRNAs exhibited the half-life values shown in Table 1. For each transcript, the maximal fold increment is given in parentheses.

