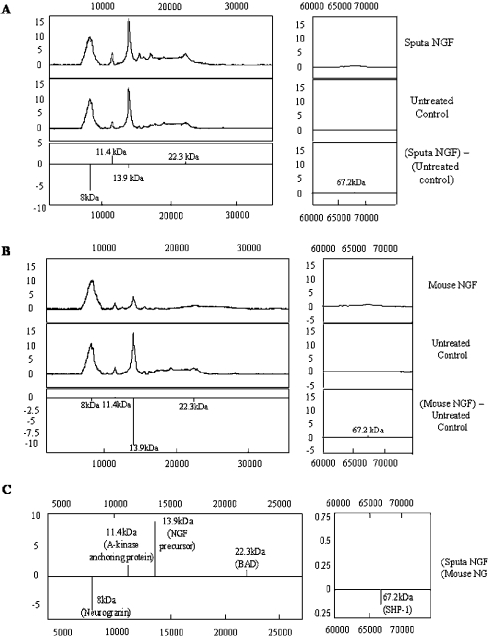
Figure 4. Protein profiling analysis.
Total protein extracts from cells treated with either mouse NGF or sputa NGF for 16–18 h were used. (A) Protein profiles obtained from cells treated with sputa NGF versus untreated control. (B) Protein profiles obtained from cells treated with mouse NGF versus untreated control. (C) Protein profiles obtained for sputa NGF versus mouse NGF.

