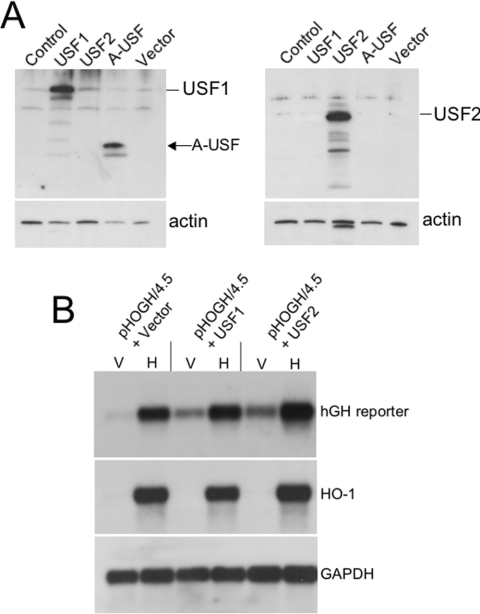
Figure 7. Effect of USF1 and USF2 overexpression on HO-1 gene expression.
(A) Confirmation of USF1 and USF2 overexpression by Western-blot analysis. HK-2 cells were transiently transfected with the indicated plasmids and duplicate blots were made out of the total cellular protein. Anti-USF1 antibody confirms USF1 and A-USF overexpression (left panel) and anti-USF2 confirms USF2 overexpression (right panel). USF1 and USF2 are recognized as positive bands at approx. 43 and 44 kDa respectively. Blots were stripped and probed with an anti-actin antibody as a loading control. Actin was identified as approx. 46 kDa protein. The band in lane 3 in the lower right panel represents residual USF2 signal not completely stripped from the blot. (B) Northern-blot analysis of HK-2 cells co-transfected with pHOGH/4.5 and either USF1 or USF2 overexpression vectors. V, vehicle-treated cells; H, haemin (5 μM)-treated cells. The blots were stripped and reprobed with a HO-1 cDNA as a control for induction and GAPDH as a control for loading and transfer of RNA.

