
Figure 2.
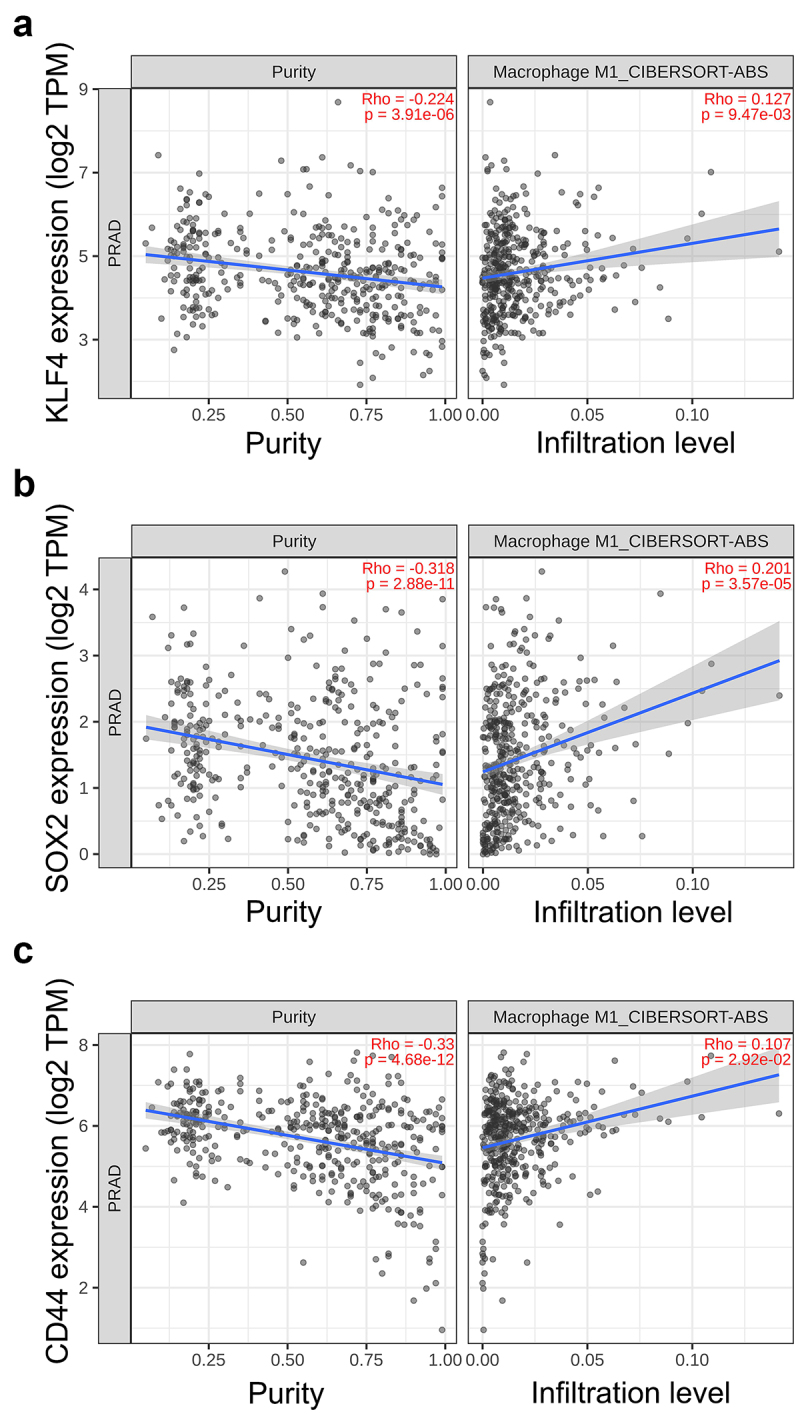
Association of CSC plasticity markers with M1 macrophage infiltration in prostate cancer patient samples. Scatter plots representing the correlation of (a) KLF4, (b) SOX2 and (c) CD44 expression with tumor purity (left) and M1 macrophage infiltration level (right) estimated by TIMER2.0 in adenocarcinoma.