
Figure 6.
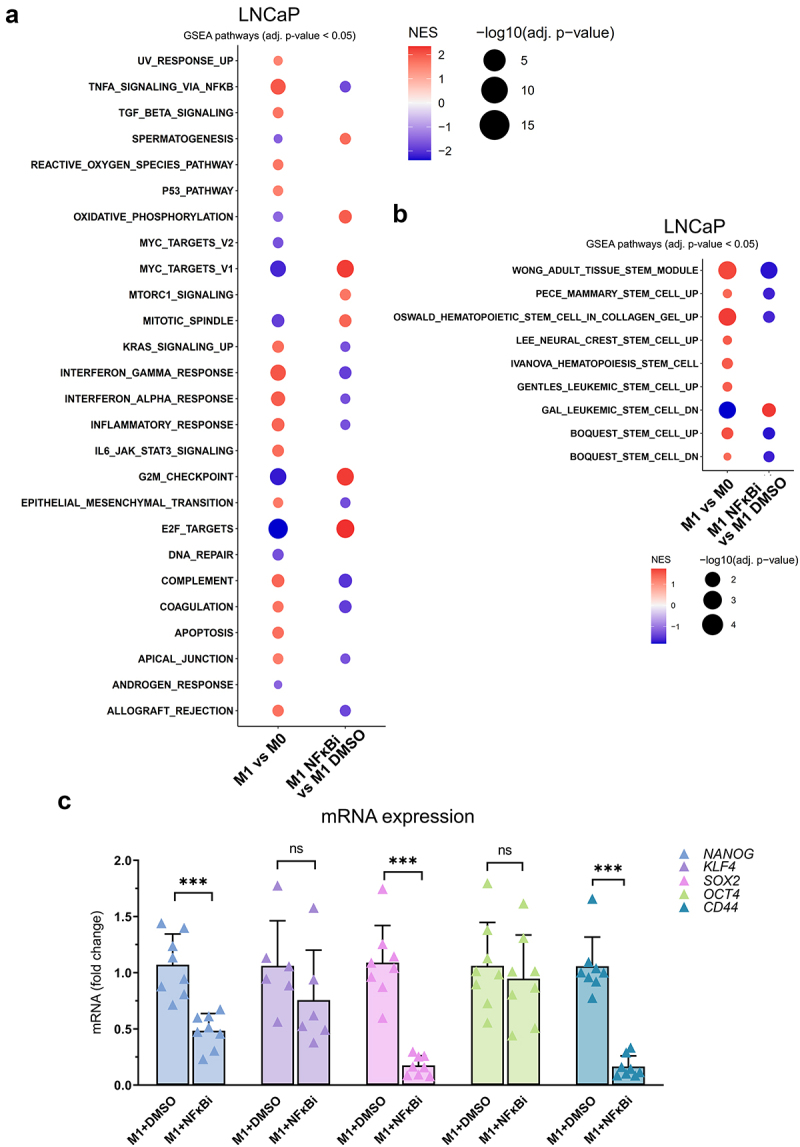
M1 macrophage -secreted factors simulate stemness gene expression pattern through NFκB signaling. (a) Enrichment of hallmark gene sets in pairwise comparisons in LNCaP cells treated with M0 or M1 CM, or M1 CM with IKK16 inhibitor (NFκBi) or DMSO. NES: normalized enrichment score, adjusted p-value <0.05. (b) GSEA from gene sets related to stem cell characteristics. (c) The effects of M1 CM NFκBi or DMSO on the expression of NANOG, KLF4, OCT4, SOX2 and CD44. The data represents mean ± SD. Statistical significances were tested with the Mann–Whitney test. *p < 0.05, **p < 0.01, ***p < 0.001, ****p < 0.0001.