Figure 7.

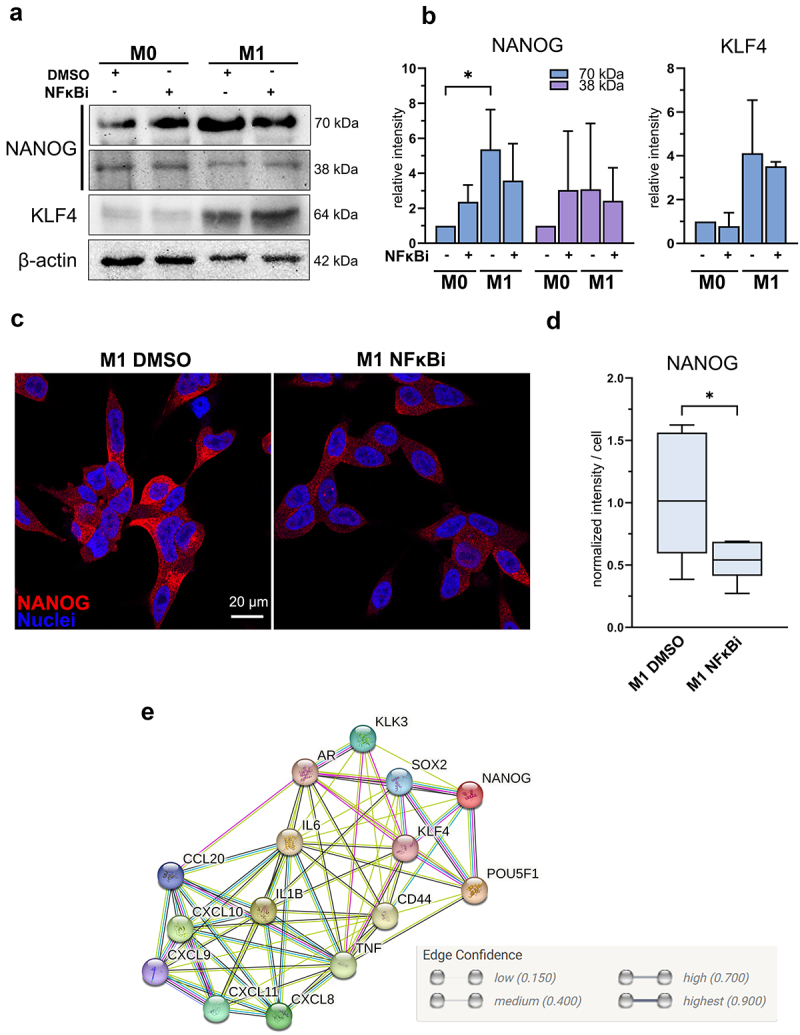
M1 macrophage -induced NANOG expression is suppressed by inhibition of NFκB signaling (a) NANOG, KLF4 and β-actin western blot images and (b) quantified band densities from LNCaP lysates after 72-hour exposure with M0 or M1 CM together with IKK16 inhibitor (NFκBi) normalized to β-actin (n = 3). Statistical significances were tested with the Kruskal-Wallis nonparametric test. (c) Confocal microscopy images from fixed LNCaP cells stained against NANOG (red) and nuclei (blue) in M1 DMSO and M1 NFκBi treatments. (d) Quantified normalized intensities of NANOG per cell. Statistical significance was tested with the Mann–Whitney nonparametric test. (e) Protein network interactions performed by STRING network analysis (version 12) with medium confidence (0.4000) threshold. The data represents mean ± SD. *p < 0.05, **p < 0.01, ***p < 0.001, ****p < 0.0001.
