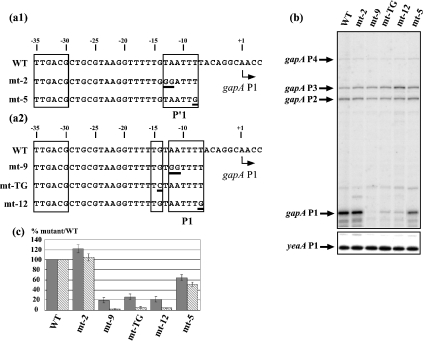
Figure 1. Promoter gapA P1 belongs to the class of extended −10 promoters.
(a1, a2) Nucleotide sequences of the two alternative −10/−35 P′1 (a1) and P1 (a2) promoters present in the gapA P1 promoter region are shown. The −10 hexamers, the TG extension and the −35 hexamer are boxed. A broken arrow marks the transcription start site (+1). Sequences of the variant gapA P1 promoter regions are shown below the WT sequence [variants with mutations in the P′1 −10 sequence (a1) and variants with mutations in the P1 extended sequence (a2)]. Positions of the base substitutions are underlined. (b) Analysis of the effects of mutations on the in vivo gapA mRNA levels by reverse transcription. Epicurian Coli™ XL1-Blue cells transformed with plasmid pBS::EcogapA carrying the WT or variant gapA P1 promoter were grown to an absorbance A600 0.5. The gapA mRNAs were analysed by primer extension under conditions allowing quantitative measurements (see the Experimental section). cDNAs corresponding to transcripts initiated at the P1, P2, P3 and P4 promoters are indicated. The yeaA mRNA primer-extension analysis (yeaA P1) was used for quantifying the effects of mutations on gapA P1 activity (see the Experimental section). (c) A histogram representing the effects of the mutations on GAPDH production and the in vivo gapA P1 mRNA level. GAPDH-specific activities and the plasmid-encoded β-lactamase-specific activities were measured as described in the Experimental section and their relative ratios in strains transformed with plasmids carrying the variant gapA genes were compared with that measured in the strain transformed with the WT pBS::EcogapA plasmid. In (c), variations of GAPDH-specific activities were represented as percentages of the GAPDH/β-lactamase ratio found for the WT plasmid (grey bars). The cDNA signals corresponding to gapA P1 and yeaA P1 mRNAs were quantified using a PhosphorImager. Variations of the gapA P1/yeaA P1 ratios (stippled bars) in strains transformed with plasmids carrying the variant genes were expressed as a percentage of the gapA P1/yeaA P1 ratio found in the strain transformed with the WT pBS::EcogapA plasmid. The values given in (c) correspond to the mean values for three different experiments and the estimated errors are indicated by vertical bars.

