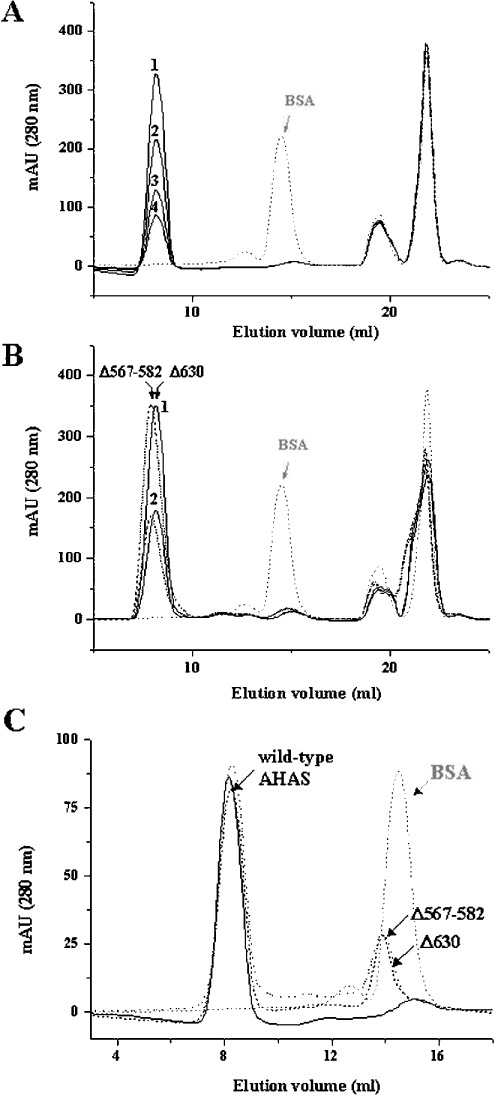
Figure 3. Gel-filtration chromatography of tobacco AHAS.
The enzymes were subjected to gel-filtration chromatography (Superdex G200 HR 10/30), and the molecular mass of the enzymes (GST-free AHAS: wild-type, 66 kDa; Δ630, 62 kDa and Δ567-582, 64 kDa) was estimated by comparison with the elution rate of BSA (66 kDa, grey dotted line, which is also indicated as an arrow) as a standard molecule. Each protein was pre-incubated in buffer A containing 20 μM FAD at 37 °C for 20 min, and subjected to loading on to the column that pre-equilibrated with the same buffer without 20 μM FAD. (A) The elution profile of wild-type AHAS. Elution rate of the major peak (1, 5 μM; 2, 3 μM; 3, 2 μM; 4, 1 μM) was much faster than that of the standard molecule (BSA). (B) The elution profiles of deletion mutants. Deletion mutants (Δ630, solid line and Δ567–582, broken line) were injected at a concentration of 6 μM (peak 1) or 3 μM (peak 2) and compared with the elution profile of BSA (arrow). (C) The elution profiles of wild-type and deletion mutants at 1 μM. When 1 μM mutant enzyme was applied to the gel-filtration chromatography column, another peak containing enzymes was observed at the position that overlapped with the peak of the standard molecule (arrow). Solid line, wild-type AHAS; dotted line, Δ567–582; broken line, Δ630.

