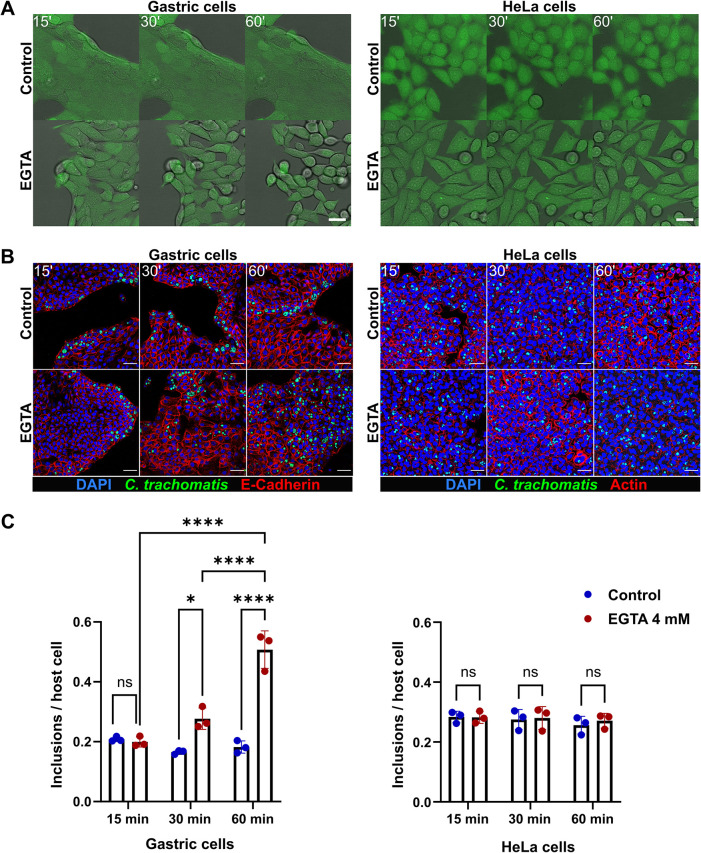
Fig 2. Disruption of the cell junctions affects the infection rate and pattern in gastric cells.
(A) Stills from live cell imaging experiment performed to monitor the effect of 4 mM EGTA on the morphology of human gastric (left panel) and HeLa (right panel) cells over the time course of treatment (green: CellTracker dye, gray: brightfield). Scale bar: 25 μm. (B) Representative confocal fluorescence images showing the effect of EGTA treatment on the outcome of infection in gastric (left panel) and HeLa (right panel) cells. Gastric and HeLa cells were pre-treated with 4 mM EGTA (for 15, 30 or 60 min) or left untreated, and infected with GFP-expressing C. trachomatis (MOI of 5 and 0.5, respectively). 24 hours p.i. the cells were fixed, stained and subjected to confocal microscopy (blue: DAPI, green: C. trachomatis, red: E-Cadherin or Actin). Scale bar: 50 μm. (C) To measure the changes of the infection rate caused by EGTA pre-treatment, the number of chlamydial inclusions and host cell nuclei was determined in 14 fields of view per sample by automated microscopy. Data represent the mean ± SD from three independent experiments. Statistical analysis was performed by two-way ANOVA (ns = not significant, *P<0.05, ****P<0.0001).

