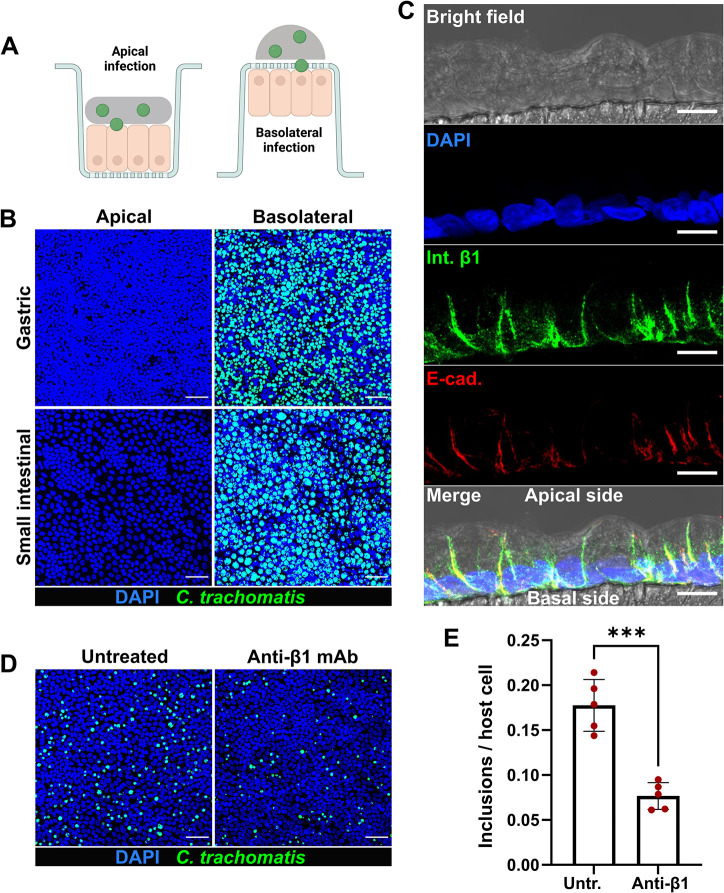
Fig 3. C. trachomatis infects human GI cells from the basolateral surface.
(A) Schematic representation of the infection setup. (B) Gastric and small intestinal cells grown on cell culture inserts were infected with GFP-expressing C. trachomatis (MOI of 5) from the apical or basolateral surface and after 2 hours of incubation the inoculum was removed, and the cells were kept in fresh organoid medium. 24 hours p.i. the cells were fixed, stained and subjected to confocal microscopy. Shown are representative confocal fluorescence Z-stack images of at least three independent experiments (blue: DAPI, green: C. trachomatis). Scale bar: 50 μm. (C) Representative confocal microscopy image showing the basolateral localization of the integrin β1 receptor in the cross-section of polarized human primary gastric cells. Human primary gastric cells were cultured on a porous polycarbonate membrane in a cell culture insert to generate a confluent and polarized monolayer. 5 μm histological cross-sections of the PFA-fixed and paraffin-embedded samples were used for the immunofluorescence analysis (blue: DAPI, green: integrin β1, red: E-cadherin). The fluorescence channels were merged with the bright field channel to visualize cell orientation. Scale bar: 10 μm. (D) The gastric cells grown on cell culture inserts were pre-treated with 25 μg/ml blocking anti-integrin β1 antibodies for 1 hour or left untreated, infected with GFP-expressing C. trachomatis (MOI of 5) for 2 hours in the presence of blocking antibodies. 24 hours p.i. cells were fixed, stained and subjected to confocal microscopy. Shown are representative confocal fluorescence Z-stack images of five independent experiments (blue: DAPI, green: C. trachomatis). Scale bar: 50 μm. (E) The number of chlamydial inclusions and host cell nuclei in (D) was quantified in at least 10 fields of view per sample using Fiji. Data represent the mean ± SD from five independent experiments. Statistical analysis was performed by unpaired t-test (***P<0.001). Fig 3A was prepared in Biorender.com.

