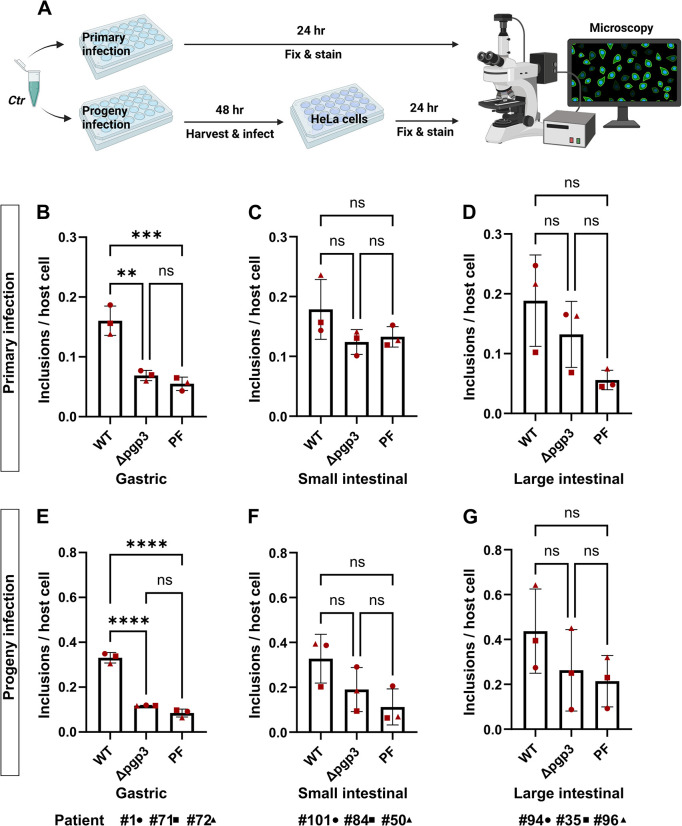
Fig 4. Pgp3-deficient C. trachomatis shows a growth defect in human GI cells.
(A) Schematic representation of the primary and progeny infection assays. To compare the infectivity of Ctr WT, Ctr Δpgp3 and Ctr PF strains in gastric (B), small intestinal (C) and large intestinal (D) cells, subconfluent monolayers of the cells were infected using MOI of 5. 24 hours p.i. the cells were fixed, stained and the infection rate was determined by quantifying the number of inclusions and host cell nuclei in 14 fields of view per sample by automated microscopy. To assess the infectivity of the chlamydial progeny, the infected cells were lysed 48 hours p.i. and freshly seeded HeLa cells were infected with an aliquot of the lysates. 24 hours p.i. the HeLa cells were fixed, stained and the infection rates for the chlamydial progenies from gastric (E), small intestinal (F) and large intestinal (G) cells were determined in 14 fields of view per sample by automated microscopy. All graphs represent the mean ± SD from three independent experiments. Statistical significance was determined by one-way ANOVA (ns = not significant, **P<0.01, ***P<0.001, ****P<0.0001). The data point numbers and shapes below the graphs refer to the donor IDs used in the experiments. Fig 4A was prepared in Biorender.com.

