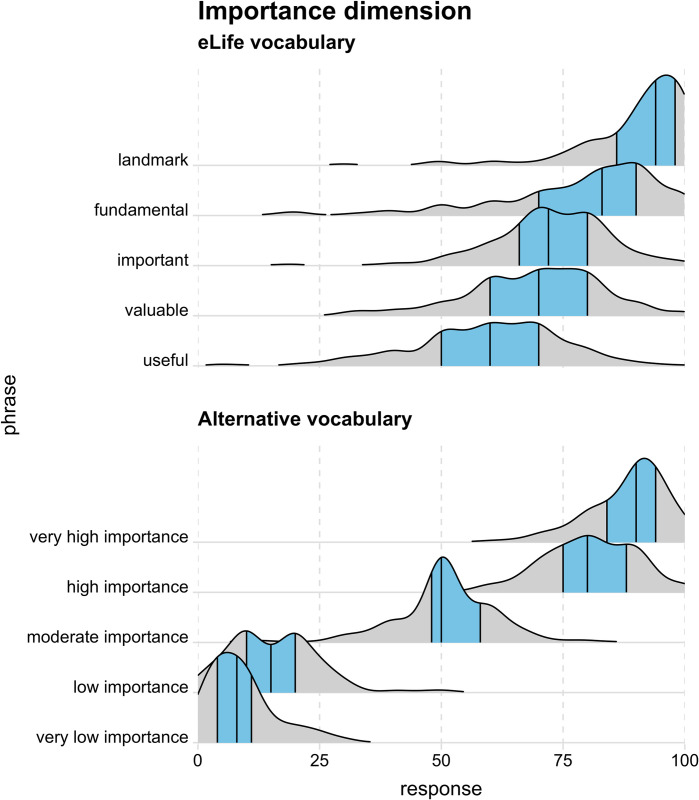
Fig 2.
Responses to each phrase on the importance/significance dimension as kernel density distributions with the 25th, 50th (i.e., median), and 75th quantiles represented by black vertical lines and the 25th–75th quantile region (i.e., interquartile range) highlighted in blue. The data underlying this figure can be found in https://osf.io/mw2q4/files/osfstorage.

