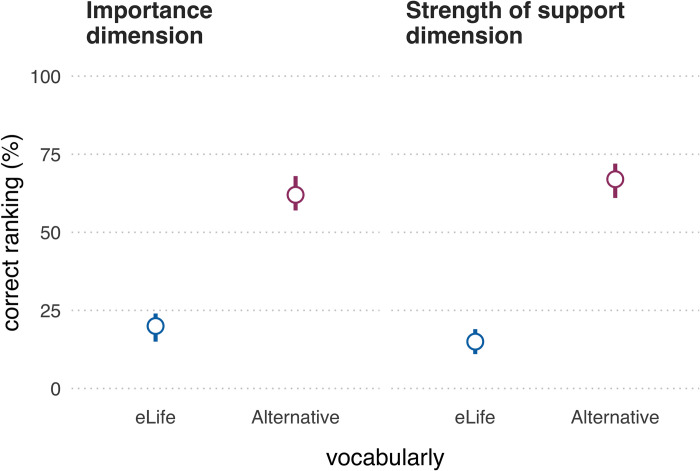
Fig 4. Proportion of participants (N = 301) whose implied ranking matched the intended ranking (i.e., “correct ranking”) for both evaluative dimensions and both vocabularies.
Error bars represent 95% confidence intervals using the Sison–Glaz method [13]. The data underlying this figure can be found in https://osf.io/mw2q4/files/osfstorage.

