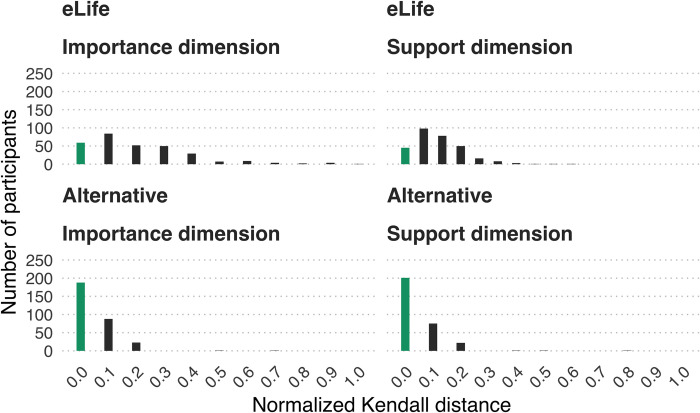
Fig 5. Extent to which participants (N = 301) implied rankings deviated from intended rankings using normalised Kendall’s distance.
Zero represents a perfect match (green bar), other values (grey bars) represent increasing dissimilarity from the intended ranking up to 1, which represents maximal dissimilarity. The data underlying this figure can be found in https://osf.io/mw2q4/files/osfstorage.

