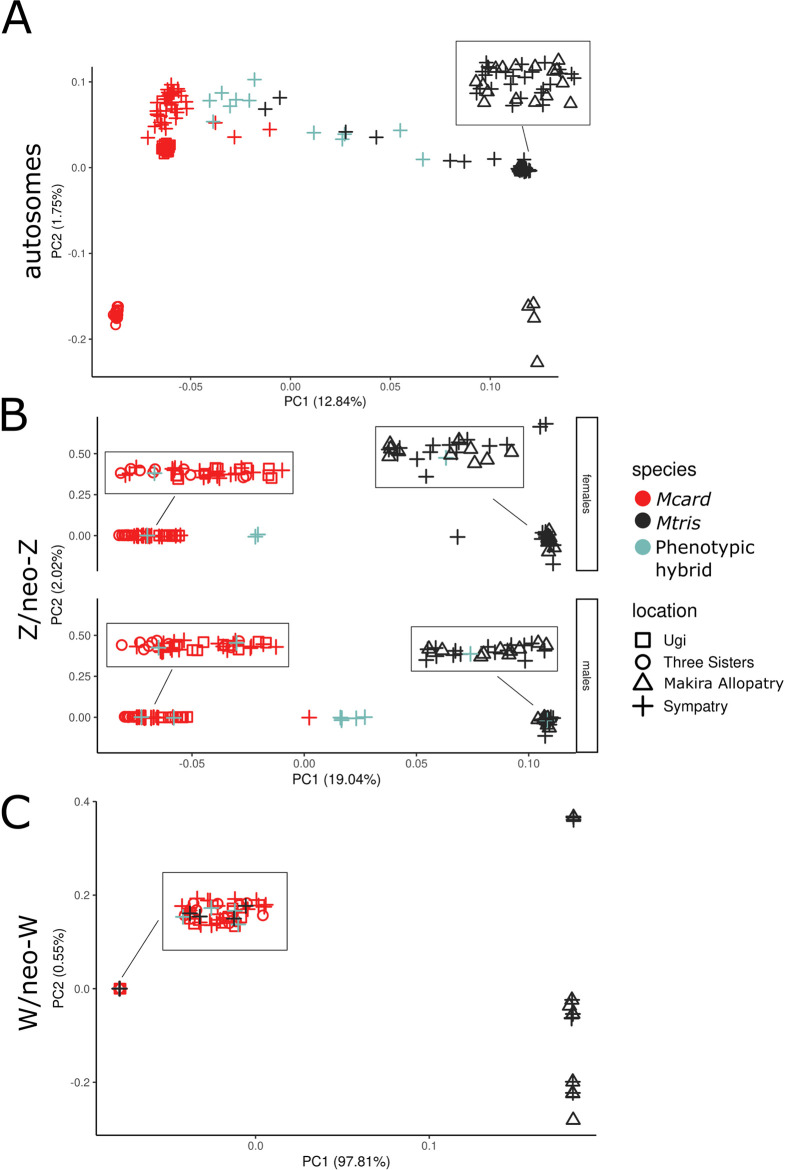
Fig 6.
Principal components analysis of autosomal (A), Z/neo-Z (B) and W/neo-W (C) sequence. Symbol color represents phenotypic species assignment while symbol shape indicates sampling locality. Inset boxes show points jittered for visualization. Plot for Z/neo-Z is separated by sex to distinguish homogametic males and heterogametic females.

