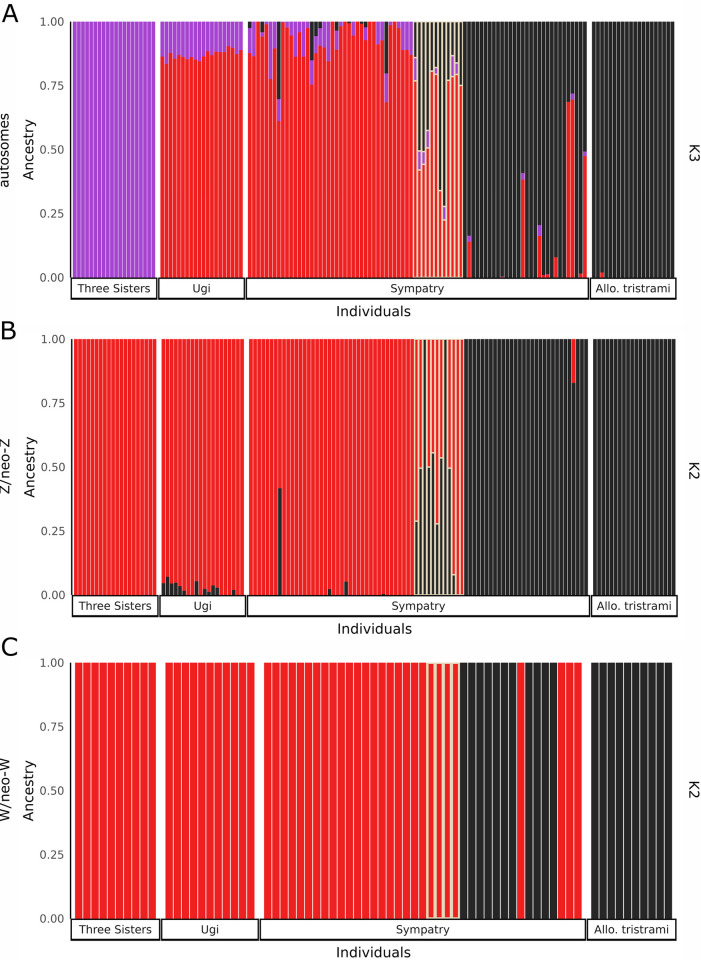
Fig 8.
Proportion ancestry calculated in ADMIXTURE for autosomes (A), Z/neo-Z (B), and W/neo-W (C). Autosomes are shown at K = 3 (see S3 Fig for K = 2), while Z/neo-Z and W/neo-W shown at K = 2. Individuals are grouped by sampling location. Phenotypic hybrids in sympatry are outlined in yellow, with phenotypic Mcard in sympatry to the left and phenotypic Mtris in sympatry to the right of phenotypic hybrids.

