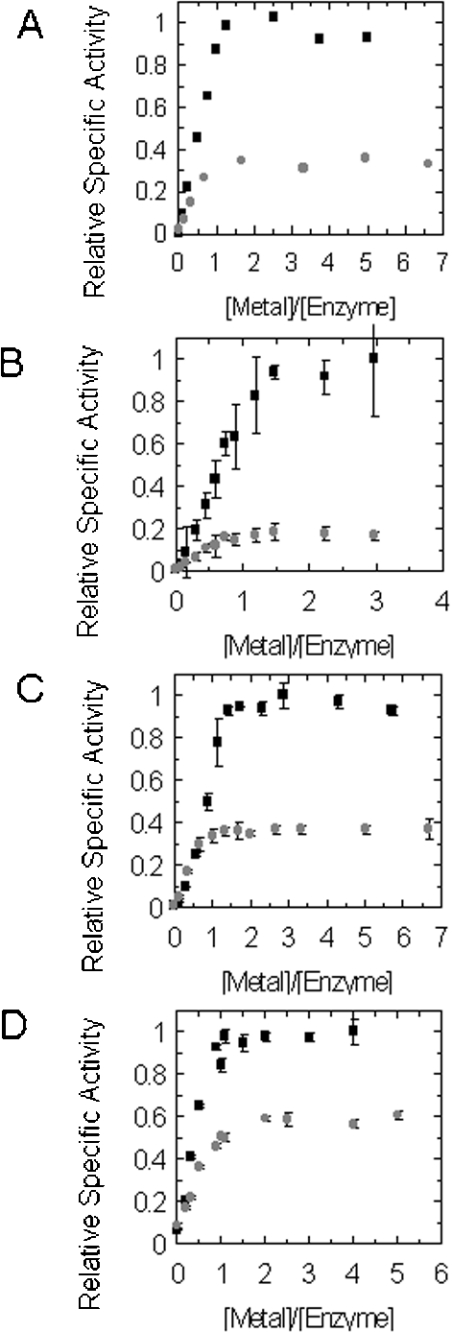
Figure 4. Titration of GlxI apoenzymes with various NiCl2 (black squares) and CoCl2 (grey circles) ratios: (A) E. coli [19], (B) Y. pestis, (C) P. aeruginosa and (D) N. meningitidis GlxI enzymes.
Data points and error bars in (B), (C) and (D) represent the specific activity±S.D. for triplicate readings. Relative specific activity values were calculated as the proportion of activity relative to the highest specific activity values obtained during the NiCl2 titration.

