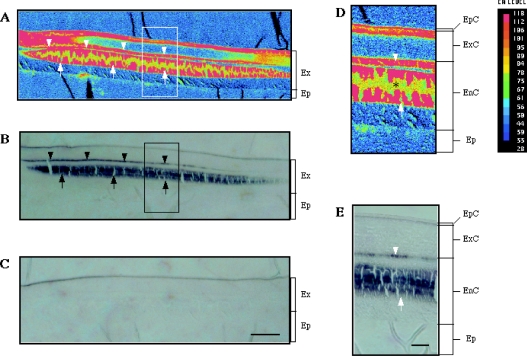
Figure 4. Calcification and CCN distribution in the integument.
(A) An X-ray intensity map for Ca content in a section of the integument which comprises the exoskeleton (Ex) and epidermis (Ep). The red and blue indicate the highest and lowest Ca contents respectively. (B) An immunostaining for CCN in an adjacent section. The two immunoreactive regions (see text) are indicated by arrowheads and arrows. (C) A negative control. Scale bar, 100 μm. (D) A magnified image of an enclosed area in (A). The exoskeleton consists of three layers, epicuticle (EpC), exocuticle (ExC) and endocuticle (EnC). The low signal levels in yellow/green parts of calcified regions (*) is due to loss of the specimen during the EMP analysis. (E) A magnified image of an enclosed area in (B). Scale bar, 25 μm.

