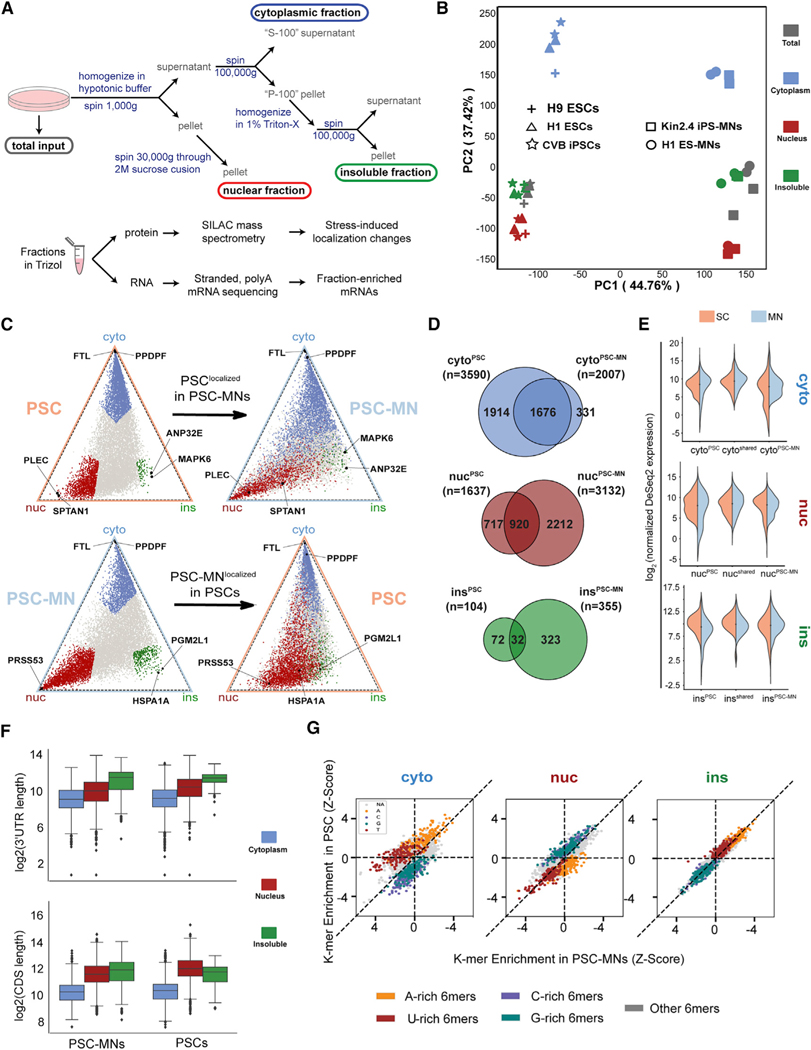
Figure 1. ceFRA-seq defines mRNA localization in pluripotent stem cells (PSCs) and pluripotent stem cell-derived motor neurons (PSC-MNs).
(A) Schematic of the cell fractionation and sample generation protocol.
(B) Principal component analysis of ceFRA-seq data from PSCs and PSC-MNs.
(C) Triangle plots visualizing the relative expression level of individual transcripts across the cytoplasmic, nuclear and insoluble fractions. Transcripts highlighted in blue (cyto), red (nuc), and green (ins) in the top panel are defined as fraction-enriched in PSCs. Transcripts highlighted in the bottom panel are defined as fraction-enriched in PSC-MNs.
(D) Venn diagrams showing fraction-enriched transcripts in PSCs, PSC-MNs, or both.
(E) Violin plots showing expression levels of transcripts that are fraction-enriched in PSCs only (left), in both PSCs and PSC-MNs (center), or in PSC-MNs only
(F) Boxplots comparing the lengths of 30UTRs (top) and CDS (bottom) in fraction-enriched transcripts across PSCs and PSC-MNs. Error bars represent the 95% confidence interval, the bottom and top of the box represent the 25th and 75th percentiles, the line inside the box is the 50th percentile (median), and any outliers are shown as closed diamonds.
(G) Scatterplots comparing enrichment of 6-mer sequence elements between PSCs and PSC-MNs across fractions. A/U/G/C-rich 6-mers are defined as containing 4 or more of the respective nucleotides within the 6-mer sequence.

