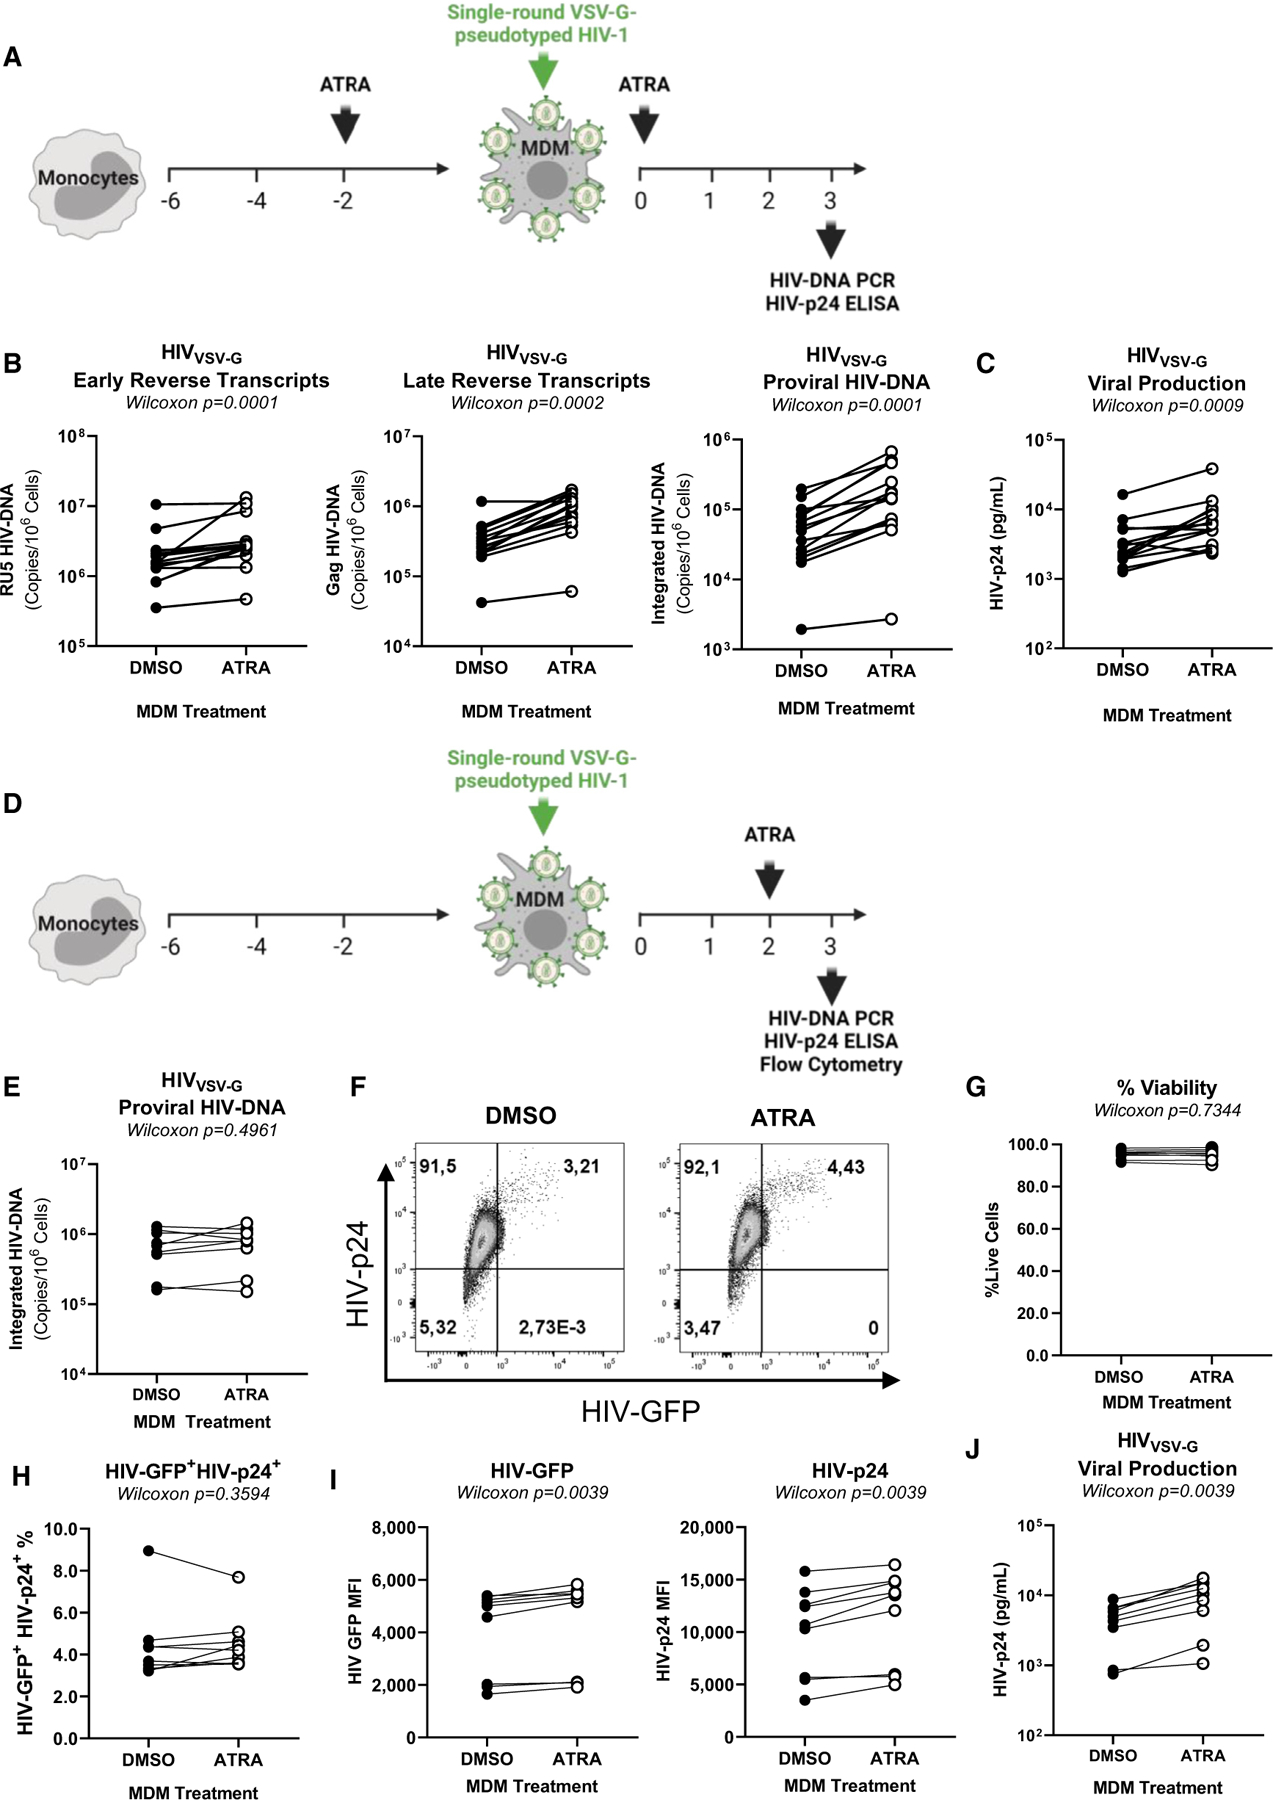
Figure 3. ATRA increases HIV-1 replication at post-entry levels before and after integration.

(A) Shown is the experimental flowchart, when MDMs were exposed to single-round VSV-G pseudotyped HIV-1 (HIVVSV-G) and treated with ATRA (10 nM) before and after infection (A–C). HIV-DNA integration and HIV-p24 levels were quantified at day 3 post infection. Shown are the levels of early reverse transcripts (RU5) (B, left panel), late reverse transcripts (Gag) (B, middle panel), and integrated HIV-DNA (B, right panel), as well as (C) HIV-p24 levels in cell-culture supernatants. (D) Shown is the experimental flowchart when MDMs were exposed to ATRA (10 nM) at day 2 post infection. At day 3 post -infection, cells were collected and analyzed for HIV-DNA integration by real-time nested PCR and for GFP and intracellular HIV-p24 expression by flow cytometry. Shown are statistical analysis of HIV-DNA integration (E), GFP, and HIV-p24 co-expression in MDMs from one representative donor (F), as well as statistical analysis of the frequency of viable (G) infected (GFP+HIV-p24+) MDMs (H), the GFP (I, left panel), and HIV-p24 (I, right panel) MFI expression from n = 9 participants. Finally, shown are statistical analysis of HIV-p24 levels in cell-culture supernatants measured by ELISA (J). Experiments were performed on MDMs from n = 14 (A–C) or n = 9 (E–J) HIV-uninfected participants. Wilcoxon p values are indicated on the graphs.
