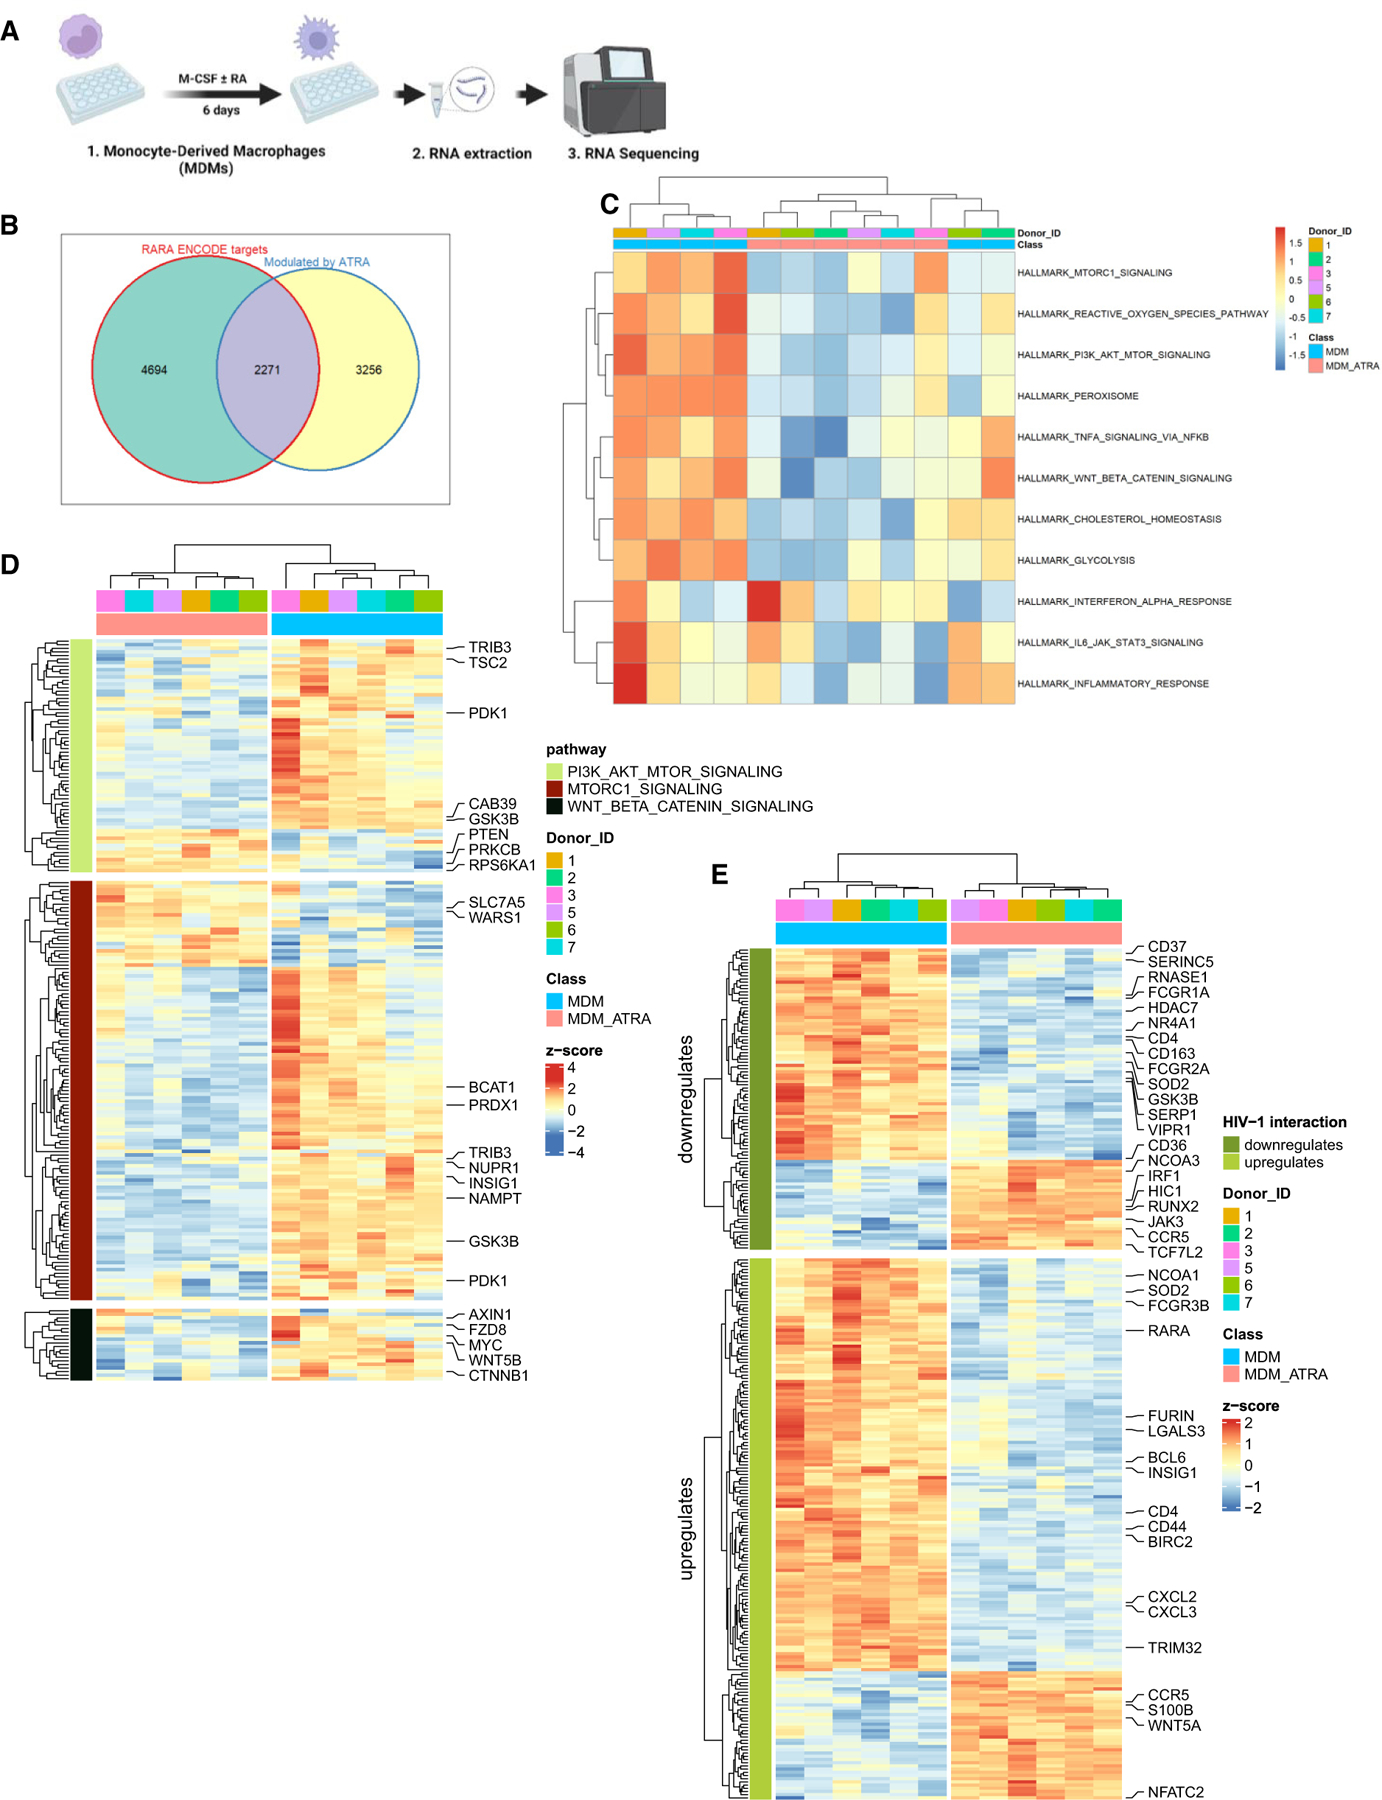
Figure 4. ATRA transcriptionally reprograms MDMs for increased expression of HIV permissiveness transcripts and pathways.

(A) Shown is the experimental flowchart. Briefly, RNA sequencing was performed on total RNA extracted from MDMs of n = 6 HIV-uninfected participants generated in the presence/absence of ATRA (10 nM) before infection.
(B) Differentially expressed genes (DEGs) were analyzed for the presence of RA-responsive elements (RAREs) in their promoters, using the ENCODE bioinformatic tool (https://www.encodeproject.org). This allowed the identification of n = 2,271 DEGs that may represent putative direct RA transcriptional targets in ATRA-treated MDMs.
(C and D) Further, gene set variation analysis (GSVA) was performed to identify signaling pathways modulated by ATRA in MDMs. Heatmaps depict top modulated signaling pathways in ATRA-treated MDMs (C), as well as gene sets (shown are selected transcripts) associated with three top modulated pathways: mTORC1, PI3K AKT mTOR, and Wnt/β-Catenin (D), as well as gene sets and selected transcripts modulated by ATRA in MDMs (p < 0.05; FC cutoff 1.3) matching the lists of genes included on the NCBI HIV interaction database (E). Heatmap cells are scaled by the expression level Z scores for each probe individually. Results from each donor are indicated with a different color code.
