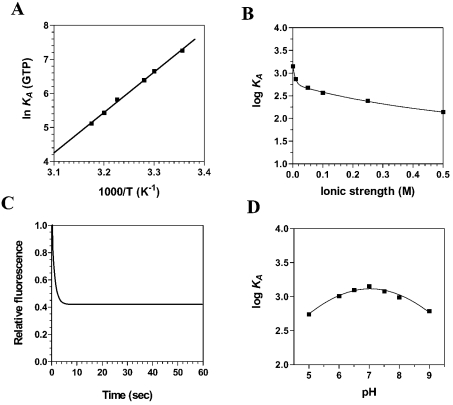
Figure 2. Binding of GTP to the Ceg1 protein.
(A) A van't Hoff plot for the interaction between GTP and Ceg1 is shown. Increasing amounts of GTP were added to a 100 nM solution of the enzyme in binding buffer (50 mM Tris/HCl, pH 7.5, and 50 mM KOAc) and the emission spectrum was scanned from 310 to 440 nm. The effect of temperature on the association constant was evaluated at pH 7.0. (B) The effect of increasing ionic strength on the association constant of Ceg1 for GTP was investigated. Increasing concentrations of KCl were added to the reactions to generate the desired ionic strengths. (C) Kinetic analysis of real-time binding of GTP to the Ceg1 protein. A 100 nM solution of the enzyme was incubated with 5 mM GTP. Emission was monitored under constant agitation for 60 s at 339 nm and excitation was performed at 290 nm. (D) Binding of GTP to the Ceg1 protein as a function of pH.

