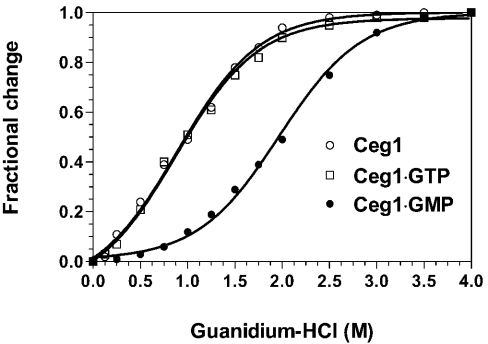
Figure 5. GdmCl-induced unfolding equilibrium of Ceg1.
Transition curves for GdmCl-induced unfolding of the free Ceg1 protein (○) or the protein bound to either GTP (□) or GMP (●) were determined. Formation of the enzyme–GTP and enzyme–GMP complexes was induced by incubating the Ceg1 protein (100 nM) with either 1 mM GTP or 1 mM GTP+50 mM MnCl2 respectively. Equilibrium unfolding transitions were monitored by integration of the fluorescence intensity.

