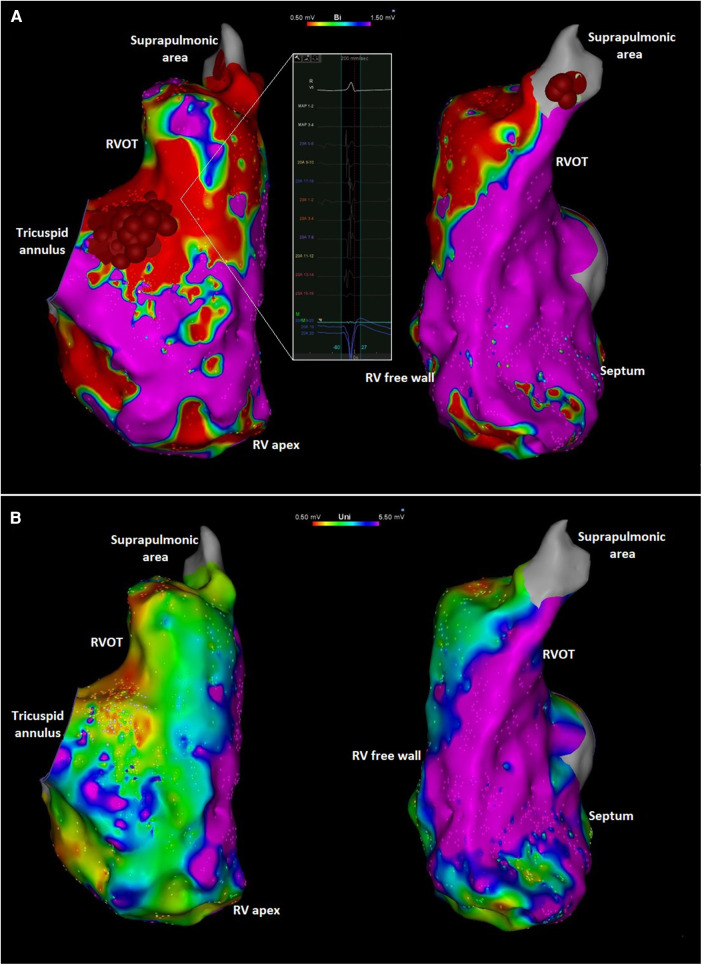
Figure 3.
(A) Right anterior oblique (left) and left anterior oblique (right) views of the endocardial right ventricular bipolar electroanatomic maps showing low voltage along the tricuspid annulus and RVOT. The inlet shows an area with low amplitude and fractionated local electrograms. Ablation targets at the peritricuspid and suprapulmonic areas are also shown. The focal abnormality at the mid-distal septum likely reflects an area targeted during PVC ablation procedure previously performed at another institution. (B) Right anterior oblique (left) and left anterior oblique (right) views of the unipolar voltage mapping of the right ventricle showing low voltage in the peritricuspid area and RVOT. Red and purple colors represent low and normal voltage bipolar electrograms, respectively (bipolar: <0.5 mV and >1.5 mV; unipolar: <0.5 mV and >5.5 mV). Intermediate colors represent borderline voltage as shown in the scale in the top center of the figure.

