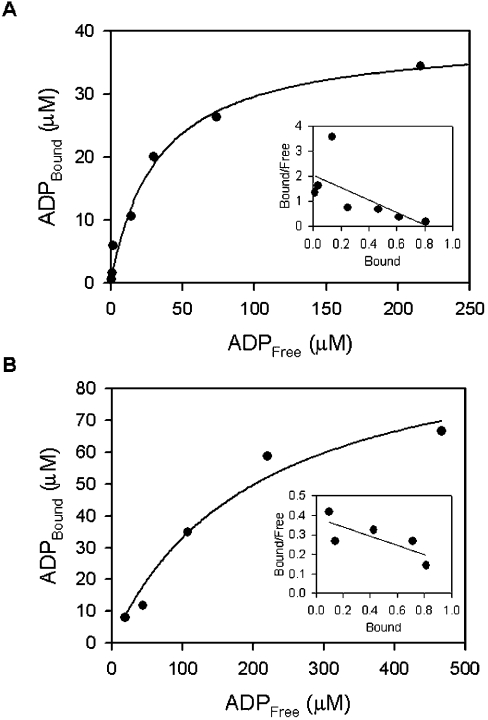
Figure 6. Determination of Kd for ADP bound to wild-type YjeE (A) and K41A variant (B) using equilibrium dialysis.
The data are presented in hyperbolic form, where [ADP]Bound is plotted versus [ADP]Free. Equilibration was attained as described in the Experimental section under the following conditions: 20 mM Tris, 2 mM DTT, 10 mM MgCl2 (pH 7.5) and 33 μM wild-type YjeE and 100 μM K41A variant respectively. The insets show Scatchard plots where the [ADP]Bound/[ADPFree] ratio is plotted as a function of [ADP]Bound. The stoichiometry of binding shows that about one molecule of ADP is bound per molecule of protein. The Kd values for ADP bound to wild-type YjeE and K41A variant were calculated to be 32 and 211 μM respectively.

