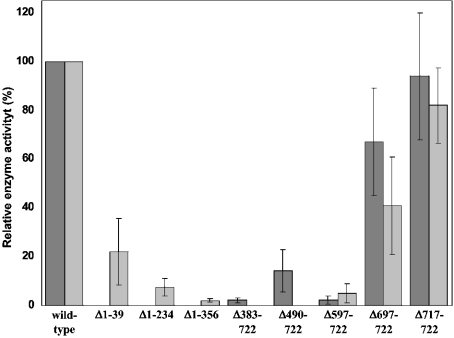
Figure 3. Relative specific enzyme activities of the UDP-GlcNAc 2-epimerase/ManNAc kinase deletion mutants.
Proteins were expressed in Sf-900 insect cells. After cell lysis and consecutive centrifugation, the supernatant was applied to the Superdex® 200 column in order to remove protein aggregates. Fractions containing the native enzymes with a size <600 kDa were analysed for UDP-GlcNAc 2-epimerase and ManNAc kinase activity using radiometric assays. Relative specific enzyme activities±S.D. (n=4) were calculated from the ratio of measured enzyme activity to the amount of UDP-GlcNAc 2-epimerase/ManNAc kinase detected by Western blotting. The calculated activities represent the average of all fractions from each mutant. Dark grey bars, UDP-GlcNAc 2-epimerase activity; light grey bars, ManNAc kinase activity.

