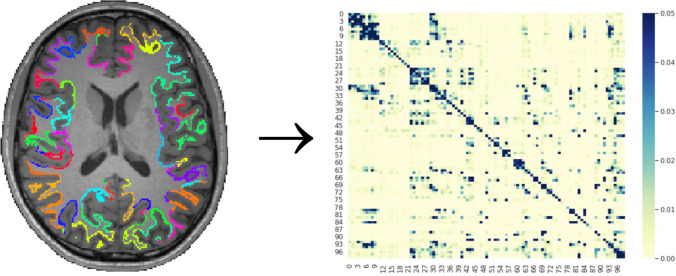
Fig. 1.
Connectivity Matrix Generation [Note. Illustration of connectivity matrix generation for one participant. The Schaefer et al. template was registered to each participant structural MRI. Using white matter segmentations and commands from Freesurfer, the portion of each parcellation overlapping with the white matter boundary was identified. These parcellation boundaries were then used as seed areas for probabilistic tractography using F ProbtrackX. An adjacency matrix was then generated for all possible pairs of areas. Graph theory metrics were then calculated for each participant’s adjacency matrix, which were used for group-level statistics.]

