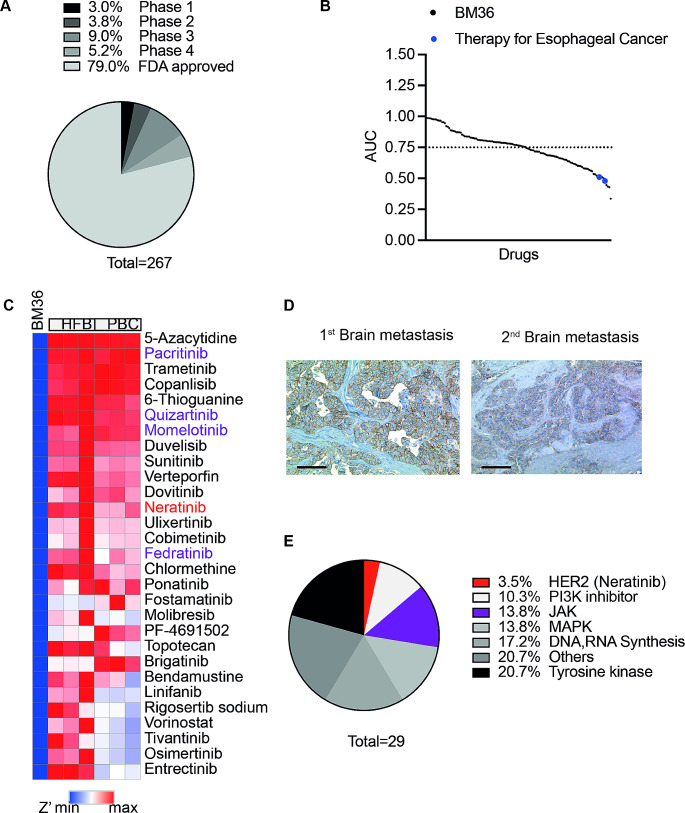
Fig. 1.
Combining molecular profiling within vitro drug screening to identify potential therapeutic options. (A) A graphical representation summarizing the different stages of clinical application and evaluation of the drugs included in the clinical library. (B) Plot of the fitted area under the dose-response curve (AUC) for 130 drugs with R2 > 0.8. The drugs have been sorted based on their AUC value. Blue dots: standard chemotherapy drugs used for esophageal cancer treatment. (C) A heatmap of Z’. Drugs with Z’<-2 were presented. (D) Immunohistochemical staining for HER2 expression in BM section of esophageal cancer in patient BM36. HER2-positive cells show a brown membranous stain. Left: Immunohistochemical staining of the first brain metastasis with intense complete membranous staining (HER2-Score 3+, scale bar: 100 μm); Right: Immunohistochemical staining of the relapsed brain metastasis with moderate staining on the basolateral and lateral sides of tumor cells (Score 2+, scale bar: 100 μm). (E) The distribution of selected potential drugs across target families

