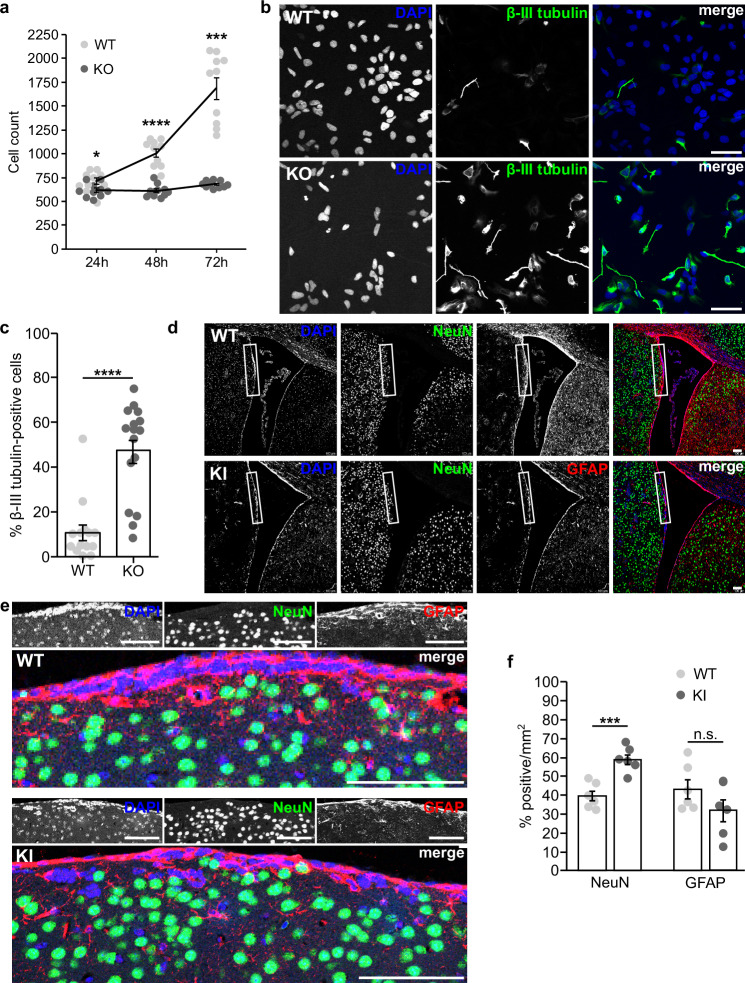
Fig. 5. Loss of DENND5A results in premature neuronal differentiation.
a Graph showing the average number of NPCs counted per well of a 96-well plate 24, 48, and 72 h after plating equal numbers of cells. Data are derived from 5 technical replicates from two independent experiments. Each dot represents the number of cells counted in one well. Data are mean ± SEM. 24 h: two-tailed t(18) = 2.168, p = 0.044; 48 h: two-tailed Welch’s t(12.96) = 8.30, p = 0.000002; 72 h: two-tailed Mann-Whitney U, Z = −3.78, p = 0.00016. b Immunostaining of β-III tubulin (green) and DAPI (blue) in NPCs one day after plating into neural progenitor maintenance medium. Scale bar = 50 µm. c Quantification of the percent of β-III tubulin-positive cells per field. A total of n = 2267 cells were analyzed from three independent experiments. Each dot represents the percentage calculated from one image. Data are mean ± SEM analyzed via two-tailed Mann-Whitney U, Z = −3.991, p = 0.000013. d Immunostaining of GFAP (red), NeuN (green), and DAPI (blue) in the SVZ of adult mice. Scale bar = 100 µm. e Close-up of the regions indicated in the insets in (d). f Quantification of the percentage of cells per mm2 labeled by NeuN or GFAP from a total of n = 4 mice. Each dot represents the percentage calculated from one image. Data are mean ± SEM. NeuN: two-tailed t(10) = −4.981, p = 0.001; GFAP: two-tailed t(10) = 1.486, p = 0.168. Source data for (a), (c), and (f) are provided as a Source Data file.

