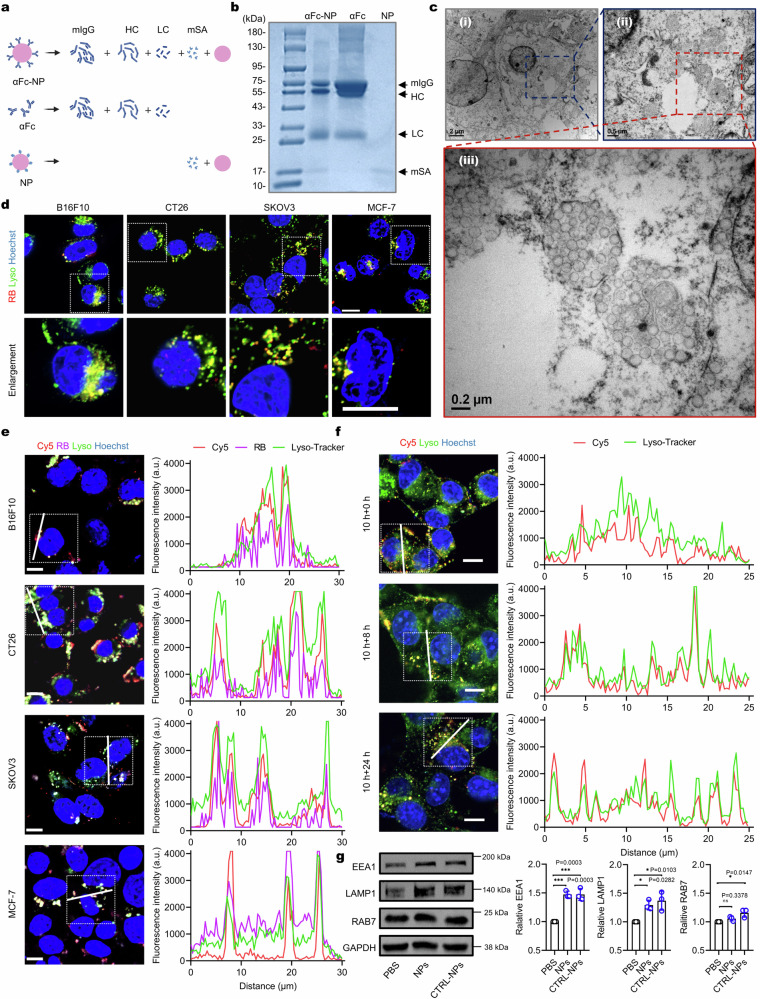
Fig. 2. Antibody anchoring does not alter the lysosome-targeting ability of NPs.
a Putative fragments of αFc-NP, αFc, and NP yielded after protein denaturation with 2-mercaptoethanol. b Reducing SDS-PAGE gel of αFc-NP, αFc, and NP with Coomassie blue staining. The gel images are representative of n = 3 independent replicates. c TEM images of cells incubated with αFc-NP (50 μg mL−1) for 8 h. The TEM images are representative of n = 3 independent replicates. d Live-cell images of B16F10, CT26, SKOV3, or MCF-7 cells treated with αFc-RBNP (100 μg mL−1) for 4 h, respectively. Scale bar, 10 μm. The images are representative of n = 3 biological replicates. e Left panel: live-cell images of different cell lines treated with RB/Cy5CTRL-NPs (50 μg mL−1) for 10 h. Scale bar, 10 μm. Right panel: Fluorescence intensity profiles along the line drawn in the box of the left panel. The images are representative of n = 3 biological replicates. f Left panel: live-cell images of B16F10 cells captured at the indicated time points after incubation with Cy5CTRL-NPs (50 μg mL−1) for 10 h and then cell washing. Scale bar, 10 μm. Right panel: Fluorescence intensity profiles along the line drawn in the box of the left panel. The images are representative of n = 3 biological replicates. g Western blots (left) and quantitative analysis (right) of EEA1, LAMP1, and RAB7 in B16F10 cells after incubation with 50 μg mL−1 CTRL-NPs or NPs for 10 h (n = 3 biologically independent experiments). Data are presented as mean ± SD where relevant. P values were determined by one-way ANOVA with Dunnett’s post hoc test. ns, no significance; *p < 0.05; ***p < 0.001. Source data are provided as a Source Data file.

