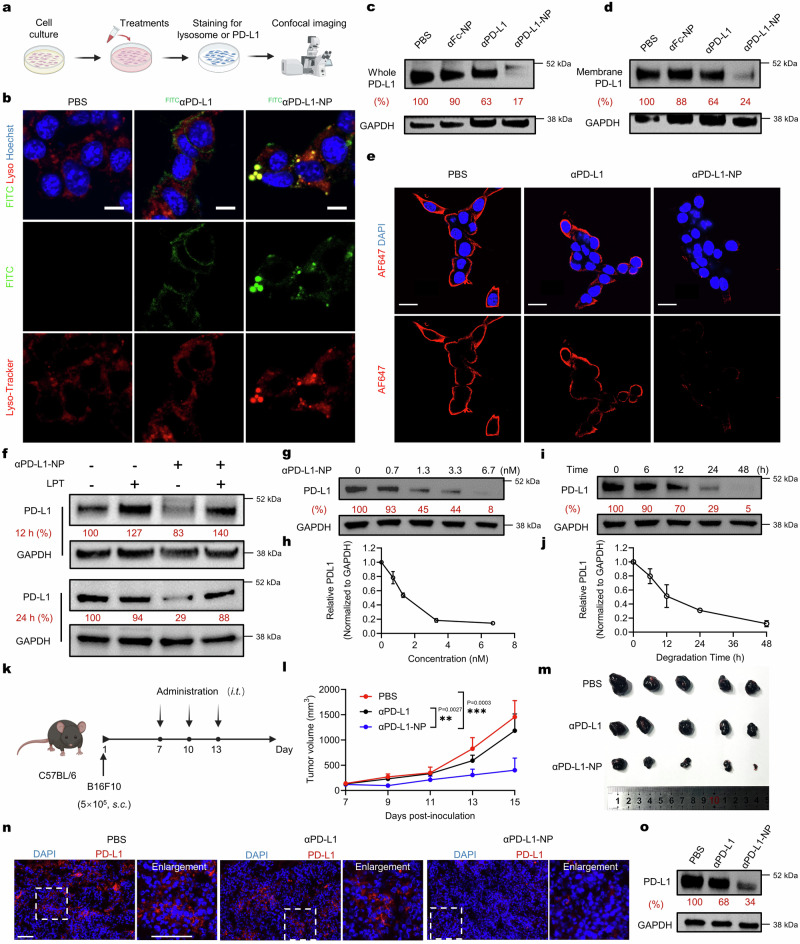
Fig. 3. Degradation of PD-L1 mediated by αPD-L1-NP.
a Schematic illustration of live-cell confocal microscopy assay. b Live-cell images of B16F10 cells treated with FITCαPD-L1 (3.3 nM) or FITCαPD-L1-NP (FITCPD-L1-equiv., 3.3 nM) for 4 h. Scale bar, 10 μm. The images are representative of n = 3 biological replicates. c, d Western blot analysis of total (c) and membrane-associated (d) PD-L1 in B16F10 cells receiving different treatments for 24 h. αPD-L1-equiv. concentration, 3.3 nM; NP-equiv. concentration, 25 μg mL−1. The blots are representative of n = 3 biological replicates. e IF of surface PD-L1 in B16F10 cells treated with αPD-L1 (3.3 nM) or αPD-L1-NP (PD-L1-equiv., 3.3 nM) for 24 h. Scale bar, 20 μm. The IF images are representative of n = 3 biological replicates. f Western blot analysis of B16F10 cells treated with αPD-L1-NP (3.3 nM) for 12 or 24 h in the presence or absence of 0.1 mg mL−1 leupeptin (LPT). The blots are representative of n = 3 biological replicates. g–j Western blot analysis of PD-L1 in B16F10 cells treated with αPD-L1-NP at the indicated concentrations for 24 h (g and h) or at 3.3 nM for the indicated durations (i and j) The blots are representative of n = 3 biological replicates. k–o In vivo antitumor study of αPD-L1-NP in B16F10 tumor-bearing C57BL/6 mice. Mice (n = 5 mice per group) were treated intratumorally (i.t.) with PBS, αPD-L1 (2.0 mg kg−1), or αPD-L1-NP (αPD-L1-equiv. dose, 2.0 mg kg−1) for three times, respectively. k Schematic diagram outlining the experimental design. l Tumor growth curves of mice receiving different treatments. m Image of tumors resected after animal euthanasia. n Immunofluorescence staining of PD-L1 in tumor sections. Scale bar, 100 μm. o Western blot analysis of PD-L1 levels in tumor lysates. The blots are representative of n = 3 biological replicates. All the uncropped blots are included in the Source Data file. Data are presented as mean ± SD. Statistical significance was calculated via one-way ANOVA with Dunnett’s post hoc test. **p < 0.01; ***p < 0.001. Source data are provided as a Source Data file.

