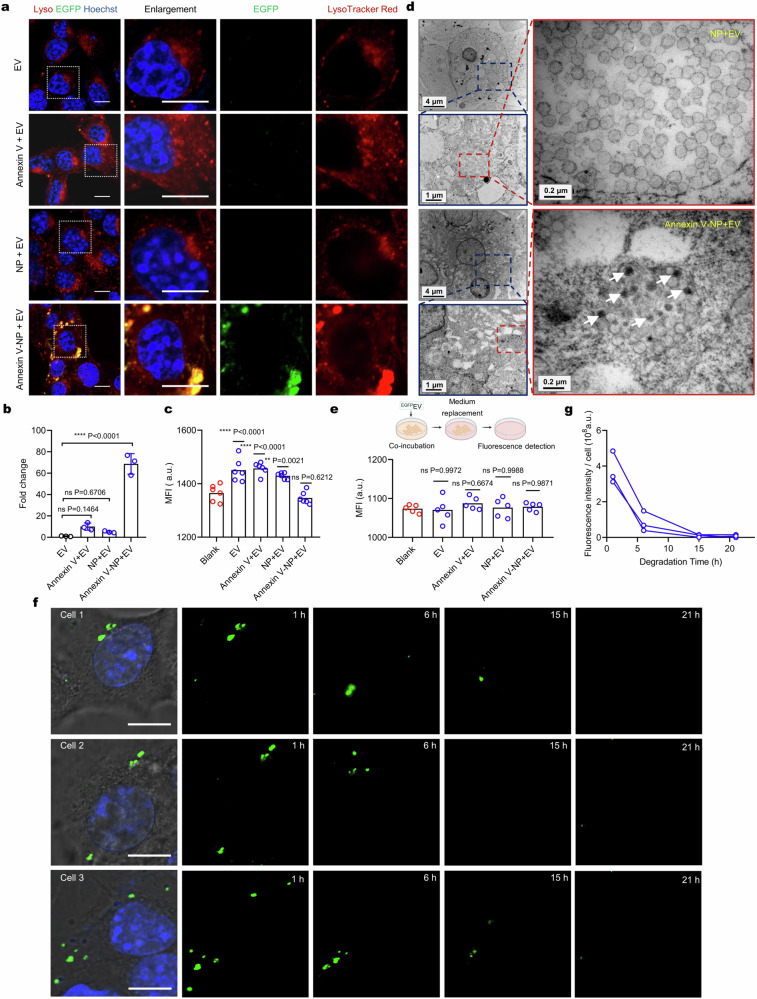
Fig. 5. Degradation of extracellular vesicles mediated by Annexin V-NP.
a Live-cell cell images of B16F10 cells incubated with EGFPEVs, Annexin-V + EGFPEVs, NPs + EGFPEVs, or Annexin-V-NPs + EGFPEVs for 8 h. The concentrations of EV, Annexin-V, and NP were 1.3 × 10⁸ particles mL−1, 0.4, and 50 μg mL−1, respectively. Scale bar, 10 μm. The images are representative of n = 3 biological replicates. b Fold changes in MFI of EGFR signal in a (n = 3 biologically independent experiments). c Fluorescence intensity of EGFPEVs in the medium after co-incubation for 8 h (n = 6 biological replicates). d Representative TEM images of cells incubated with NPs + EVs or Annexin-V-NPs + EVs for 8 h. Scale bars are defined on the panel. White arrow points to the internalized EVs. The images are representative of n = 3 biological replicates. e Fluorescence intensity measurement of exocytosed EGFPEVs in the medium (n = 5 biological replicates). f Real-time tracking of EGFP signal in individual cells after incubation with EVs (1.3 × 10⁸ particles mL−1) and Annexin V-NPs (50 μg mL−1) for 8 h. Scale bar, 10 μm. Cells 1–3 represent randomly tracked n = 3 single cells. g Fluorescence intensity of EGFP signal in individual cells at the indicated time points. Data are presented as mean values ± SD where relevant. Statistical significance was calculated via one-way ANOVA with Dunnett’s post hoc test. ns, no significance; **p < 0.01; ****p < 0.0001. Source data are provided as a Source Data file.

