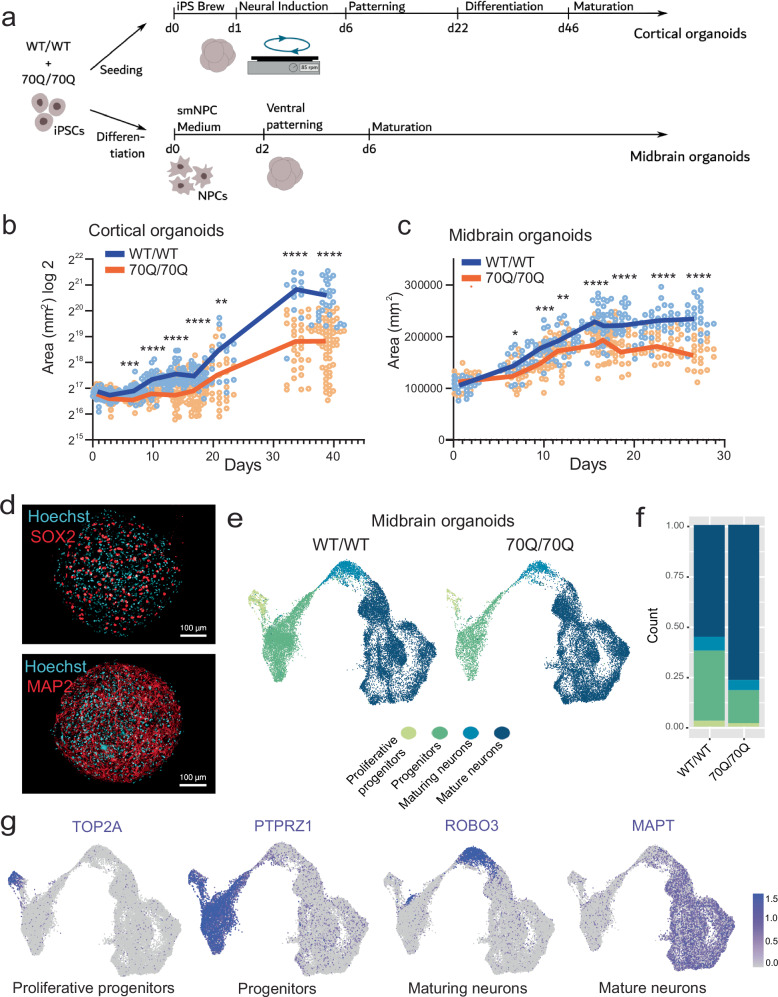
Fig. 2. mHTT compromises development and neural progenitor population in region-specific brain organoids.
a Schematics of the protocol to generate guided region-specific brain organoids from iPSC lines WT/WT and 70Q/70Q. For cortical organoids, we started the differentiation from iPSCs, for midbrain organoids we started from NPCs. b Growth curve of cortical organoids. Dots represent individual organoids over at least two independent experiments. We compared organoid size at defined time points (day 1, 2, 7, 10, 14, 17, 21, 34, 39): ***p < 0.001, ****p < 0.0001 WT/WT vs. 70Q/70Q; two-tailed Mann-Whitney U test. c Growth curve of midbrain organoids. Dots represent individual organoids over at least two independent experiments. We compared organoid size at defined time points (day 1, 7, 10, 12, 16, 17, 19, 23, 27): ***p < 0.001, ****p < 0.0001 WT/WT vs. 70Q/70Q; two-tailed Mann-Whitney U test. d Midbrain organoids stained for neural progenitor marker SOX2 and neuronal marker MAP2 to show their uniform distribution within individual organoids. Data were repeated in two independent experiments. Scale bar: 100 µm. e Single-cell analysis of midbrain organoids. Uniform manifold approximation and projection (UMAP) showing the overall cell composition of WT/WT and 70Q/70Q midbrain organoids. Each sample was sequenced in three biological replicates, with each replicate containing around 48 individual midbrain organoids. Shown here are merged UMAP images for all three replicates for WT/WT and three replicates for 70Q/70Q. f Quantification of the four annotated cell populations in WT/WT and 70Q/70Q midbrain organoids. g Distribution of exemplary markers for each of the four cell populations composing the midbrain organoids (see Supplementary Data 1).

