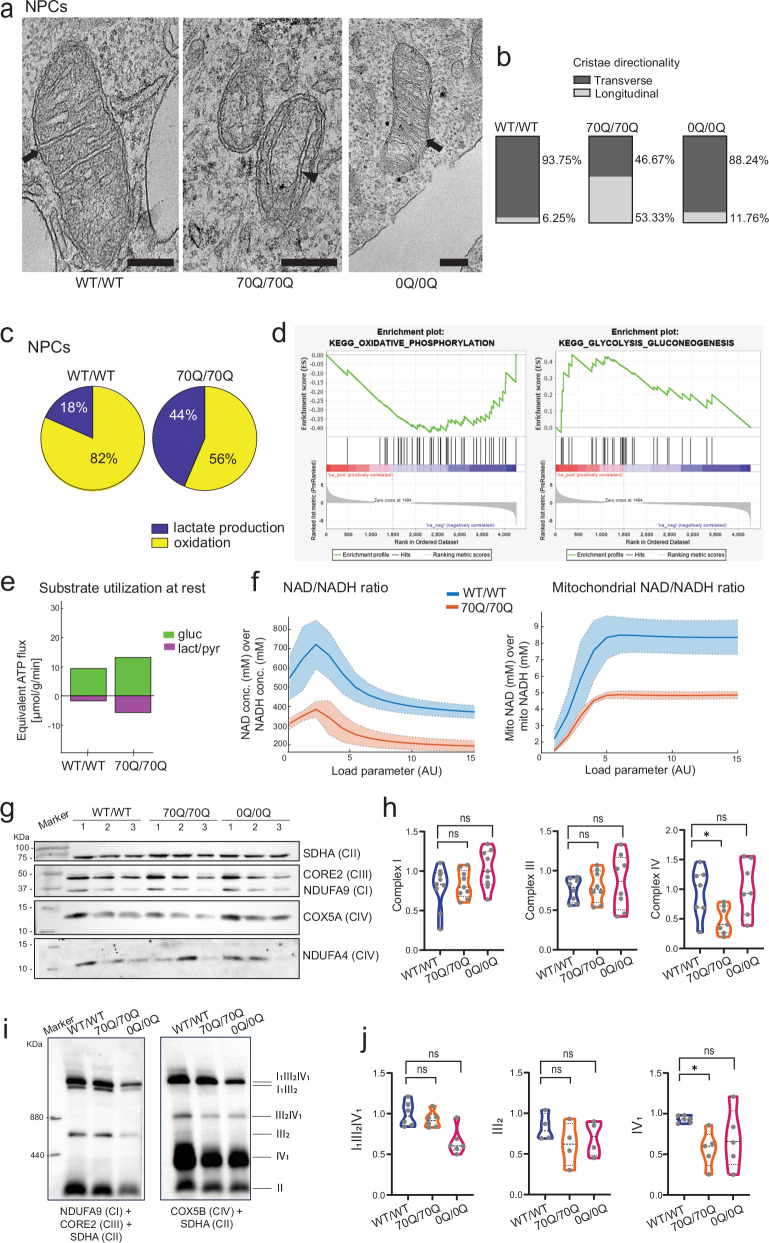
Fig. 5. Neurometabolic defects induced by mHTT.
a Representative electron microscopy images of mitochondria within WT/WT NPCs, 70Q/70Q NPCs, and 0Q/0Q NPCs. Arrows indicate mitochondrial cristae with transverse direction with respect to mitochondrial outer membrane. Arrowhead indicates cristae with longitudinal direction. Data were repeated in two independent experiments. Scale bar: 200 nm. b Quantification of cristae direction in NPCs from WT/WT, 70Q/70Q and 0Q/0Q. For each sample, a minimum of 15 different mitochondrion were considered out of at least two biological replicates. c Proteomic-driven functional metabolic analysis (see Supplementary Data 7) depicting relative glucose utilization at resting energy demands in NPCs. d Gene Set Enrichment Analysis (GSEA) showing decreased oxidative phosphorylation (OXPHOS) and increased glycolysis/gluconeogenesis in 70Q/70Q NPCs compared to WT/WT NPCs. e Substrate utilization at rest in NPCs from WT/WT and 70Q/70Q. Energetic capacities were evaluated by computing the changes in metabolic state elicited by an increase of the ATP consumption rate above the resting value. mHTT-carrying cells showed higher consumption of glucose (gluc) and higher production of lactate-pyruvate (lact/pyr). f Metabolic state variables for NAD/NADH ratio and mitochondrial NAD/NADH ratio in NPCs in dependence of increasing energetic demands. Lines and colored areas represent mean ± s.d. g, h SDS-PAGE analysis and related quantification of mitochondrial complex I, III, and IV subunits in WT/WT NPCs, 70Q/70Q NPCs, and 0Q/0Q NPCs. n = 3 independent biological replicates per line run in three different blots; *p < 0.05, ns: not significant; unpaired two-tailed Welch t test. i, j Blue native PAGE analysis and related quantification of complexes III2 and IV, and supercomplexes I1III2IV0–1 assembly in WT/WT NPCs, 70Q/70Q NPCs, and 0Q/0Q NPCs. n = 3 independent biological replicates per line run in two different blots; *p < 0.05, ns: not significant; unpaired two-tailed Welch t test.

