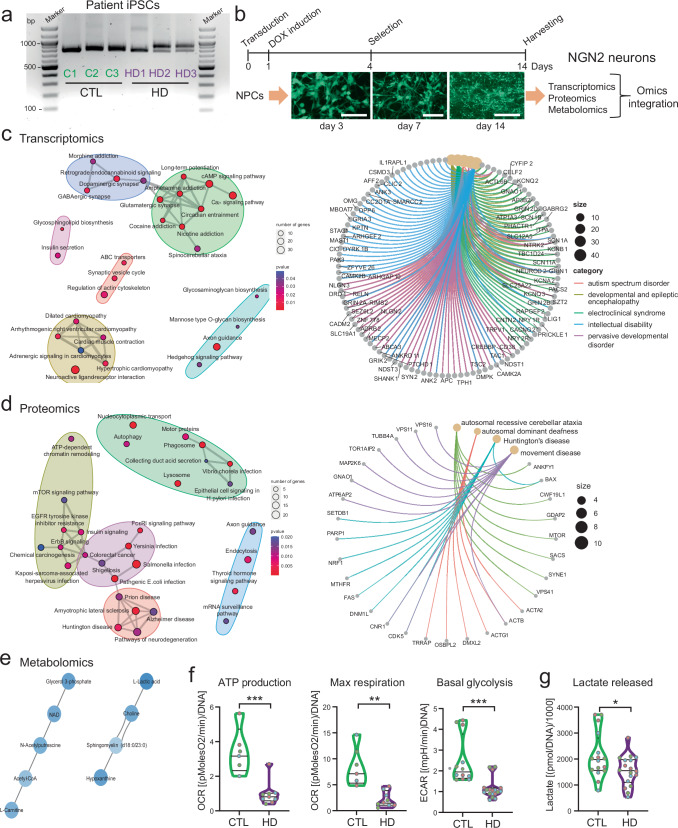
Fig. 6. Multi-omics signature of NGN2 neurons from individuals with HD underscores developmental and metabolic defects.
a PCR analysis of HTT in NPCs derived from three healthy controls (C1, C2, C3) and three individuals with HD (HD1, HD2, HD3, carrying WT/180Q, WT/58Q, and WT/44Q, respectively). Data were repeated in three independent experiments. b Schematics of Neurogenin 2 (NGN2)-based neuronal induction in NPCs from healthy controls (C1, C2, C3) and HD individuals (HD1, HD2, HD3). Scale bar: 100 µm. c Enrichment analysis of differentially expressed genes (DEGs) in NGN2 neurons from HD individuals compared to controls, hypergeometric test one-sided with FDR adjustment for multiple comparisons (filter for p value < =0.05). Left: over-representation analysis (ORA) of upregulated DEGs for KEGG pathways; right: ORA of upregulated DEGs for human diseases. Yellow nodes represent the enriched diseases and gray nodes their associated genes, with colored edges indicating their connection (see Supplementary Data 7). d Enrichment analysis of differentially expressed proteins (DEPs) in NGN2 neurons from HD individuals compared to controls, hypergeometric test one-sided with FDR adjustment for multiple comparisons (filter for p-value < =0.05). Left: ORA of upregulated DEPs for KEGG pathways; right: ORA of upregulated DEPs for human diseases (see Supplementary Data 8, 9). e Enrichment analysis of differentially expressed metabolites (DEMs) in NGN2 neurons from HD individuals compared to controls (see Supplementary Data 10). Interactions between the significantly dysregulated metabolites. f Mitochondrial bioenergetics based on oxygen consumption rate (OCR) and glycolysis based on extracellular acidification rate (ECAR) measured by Seahorse profiling in NGN2 neurons from controls (C1, C2, C3) and HD individuals (HD1, HD2, HD3). n = 3 independent biological replicates per line (different colors of dots refer to the three replicates). *p < 0.05, **p < 0.01, ***p < 0.001; unpaired two-tailed t test. g Quantification of lactate released in the supernatant by NGN2 neurons at the end of Seahorse experiments. *p < 0.05; unpaired two-tailed t test.

